Showing posts with label stock review. Show all posts

Sunday, August 2, 2020

Stock Review: If I were to pick a Hotel Trust

With the ongoing Covid19 pandemic, hotel revenues have been hit hard as travel restrictions have literally stopped all tourism, business travel and convention/exhibition events. Previously, those were the main revenue drivers for hotels and the occupancy rate had been increasing in the past 5 years, maintaining above 85%, which drove more investors to build more hotels over the next few years. When every hotel owner plans based on forward supply growth (based on then-room rates and then-occupany rates), and demand drops, we will be seeing some hotels closing or possible converting to more profitable residential properties like what happened in the past.

Extracted from Far East FY2019 Financial Report Slides - Hotel Supply

Extracted from Far East FY2019 Financial Report Slides - Visitor Arrivals
The main criteria that I will be assessing is the survivality. Basically if the REIT can survive the demand drop and hence price drop, they will have an advantage when the up-cycle restarts.

I browsed the financial reports of these 4 REITS:
  1. Ascott Residence Trust (2Q2020, end 30/6)
  2. CDL Hospitality Trust (2Q2020, end 30/6)
  3. Far East Hospitality Trust (4Q2019, end 31/12)
  4. Frasers Hospitality Trust (2Q2020, end 31/3)

1. Net Asset Value (NAV)

NAV is the valuation of all assets in the REIT. For hotels, it's primarily based on how much income the properties can earn. Prices will definitely fall, based on the financial reports from Ascott and CDL,  current prices, it has fallen by at least 50%, for those hotels that are operating. Those that are forced to closed are not part of the statistics. I did not manage to find a copy of Far East's financial report. Only Singapore and Australia are using some of their hotels and serviced apartments as facilities to house people who are entering the country, i.e. Stay-Home-Notice facility. This has provided Ascott and CDL with some reprieve.
Extracted from respective financial reports
I compiled the highest and lowest prices in the last 52 weeks. Only Ascott did not fall below 50% of its NAV, and was trading at the highest P/B ratio, 55% of NAV (52 week low) and 73% of NAV (current) which shows more investor confidence in Ascott. Far East was the lowest at 41% of NAV (52 week low) and 57% of NAV (current).

2. Debt

The most risky part of a REIT is its debt. It is only profitable if they can maintain low interest rates, hence REITs have been merging increase their size so that they have better economies of scale to reduce management and financing costs. The main things I look for are average interest rates and off-balance sheet debt. The interest rates the REIT gets from the bank reflects the bank's risk appetite for their assets, i.e. the higher the rate, the less "faith" the bank has, and they have to source other financing (like corporate bonds). In this aspect, Ascott has the lowest interest rate of 1.8%.

Next is off-balance sheet debt in the form of Perpetual Securities (Perps). It's off-balance sheet because it's not shown on the balance sheet -- you have to scroll to the table that records it to see how much there is, and then manually calculate the debt/asset ratio because the debt/asset ratio that the REITs report excludes these debt.
Extract from Ascott - Statement of Movement in Stapled Securityholders Funds
Ascott has $396M of Perps and Fraser has $100M. CDL and Far East did not record any in their financial reports. I recalculated the debt % with the Perps added in. Ascott is no longer the lowest after that.

Extracted from respective financial reports - debt %
CDL is a little bit less indebted than Ascott. Ascott and CDL published their Fitch Ratings BBB and BBB- respectively.

Far East and Fraser are paying about 1% more in interests. They did not publish any ratings. Not getting themselves rated doesn't mean that they are bad too. However, Fraser Centerpoint Trust published their BBB rating.

3. Dividends

Normally, it will be a factor, however there is nothing to evaluate now because hotels are not in business.
Extracted from respective financial reports - dividends
Ascott and Fraser are positive mainly because they have serviced apartments that bring in income. CDL is negative.
Extracted from respective financial reports - profit

Based on the P/B and debt, I prefer CDL Hospitality Trust, but I also feel that I need more margin of safety because income is near 0 or even negative for the coming months. Hence I will only enter at 40% of NAV or $0.59. Tourism is unlikely to return to full scale immediately. SIA had also provided guidance that they are planning for recovery to be at max 50% of previous capacity, With half the visitors, room rates will likely fall by half, especially those at non-prime locations.

The writer does not own any of the stocks mentioned.

Monday, March 30, 2020

Stock Review: SIA

It has been a while since I last checked on SIA. This was my last review in Aug 2018 and I assessed that SIA's dividends were funded by debt, i.e. SIA borrows money from the bank to distribute to its shareholders. Another company whose dividends are debt funded is Starhub and their share price has only gone one way down. Side track: A quick way is to look at the metric dividend payout ratio. A ratio that is <100% means that dividends are paid out of profits. If it's >100%, then there are two possibilities, either they are paying the additional dividends from their cash balance, or they are paying from debt. Usually you need to read the financial report, compare the debt and cash balance to know which scenario is it.

SIA has grounded 96% of their flights to date. They need money to operate and I earlier estimated that they will run of cash in 2 months. There are two ways to raise money: borrow or you exchange paper for money aka print money. If you borrow, you have to return what you borrowed with interests. If you print, you don't have to return and you don't have to pay interest. So SIA obviously chose to print money. Who wouldn't right?

Link to the press release. Extracted key points below:
In a late announcement on Thursday, the airline said it is proposing a renounceable rights issue of up to 1.77 billion new shares at S$3 per share, on the basis of three rights shares for every two existing shares held by shareholders, to raise S$5.3 billion. The issue price represents a discount of about 53.8 per cent to the last transacted price of the S$6.50 on March 25. It added that the theoretical ex-rights price will be S$4.40.
SIA is also proposing to raise up to S$3.5 billion via a 10-year mandatory convertible bond (MCB) issue on the basis of 295 Rights MCBs for every 100 existing shares owned. The bonds, which come with zero coupon, will be priced at S$1 each. If not redeemed before the maturity date in 10 years, the MCBs will be converted to new shares based on a conversion price of S$4.84, which is a 10 per cent premium to the ex-rights theoretical price.
In addition, SIA will also be seeking approval to further issue up to S$6.2 billion of additional MCBs on similar terms and to be offered to shareholders via one or more rights issues down the line. This could take place within 15 months of being approved by shareholders.

SIA will be issuing rights (akin to printing money), 3 rights shares for every 2 shares you hold at $3/rights share. This means that the shares will be diluted, the existing shares will form 40% and the new shares from the rights issue will form 60%. Now maybe you receive $0.30 for every 1 share you own, but after the rights issue, because more people are sharing the pie, you will only get to eat $0.30 x 40% = $0.12/share.

What's peculiar about this rights issue is that they also have a convertible bond with no coupon (i.e. no interest). The catch is if SIA does not return the money, SIA will need to issue more shares. Based on SIA's past record, in a good year with $1B profit, they pay you $0.30/share of dividends. Assuming they continue to pay you $0.30/share, they will only have $650M left. They will need to save up $3.5B / 650M = 5.4 good years to return the money to shareholders. Temasek likely negotiated to give them 10 years to save it up. If a recession were to happen and SIA is unable to have a good year, assuming flights are 100% and profits are halved at $500M, SIA will need to presumably halve its dividend ($0.15/share), with $300M left. They will need to save up $3.5B / 300M = 11.7 years to return the money to shareholders. This means that over the next 10 years, SIA needs a few good years and no more flight grounding epidemics to be able to return $3.5B.

SIA is also seeking approval to have another $6.2B MCB on the same terms via one or more rights issues to shareholders within 15 months of approval, which means near term. This is scary. Returning $3.5B sounds like a mean feat. If they were to need $6.2B in the coming 15 months, redeeming $3.5B + $6.2B = $9.7B 10 years from now will be impossible because it means SIA needs 10 good years ($1B/year) and not pay out any dividend and no more similar epidemic (which is practically beyond control).

So the best case scenario is SIA returns all the $3.5B or $9.7B if they were to need the additional $6.2B within the next 15 months.

Current total shares = 1.19B
Total shares after 3-for-2 rights issue = 1.19B x 2.5 = 2.975B
Dilution effect = 1.19B/2.975B = 0.4

If SIA is unable to repay the $3.5B or $9.7B, all share holders who subscribed to the MCB will get more shares in SIA "295 Rights MCBs ($1 each) for every 100 existing shares owned, where rights are converted at $4.84/share".

Then the better case scenario, is where there is only $3.5B MCB.

Conversion of MCB to shares for $3.5B MCB = 3.5B / $4.84 = 0.723B shares
Total shares after $3.5B MCB conversion = 2.975B + 0.723B =  3.698B shares
Dilution effect = 1.19B/3.698B = 0.322

Worse case scenario, $9.7B MCB
Conversion of MCB to shares for $9.7B MCB = 9.7B / $4.84 = 2.004B shares
Total shares after $9.7B MCB conversion = 2.975B + 2.004B = 4.979B shares
Dilution effect = 1.19B/4.979B = 0.239

Worst case scenario: SIA becomes bankrupt.

How much do you have to pay as a shareholder to subscribe to all the rights and MCB?
If you own 1000 units of SIA now, you will be entitled to
- 1500 rights @$3 each
- 295/100 x 1000 = 2950 MCB rights @$1 each (converted to 610 shares)
Total cost to you = 1500x3+2950 = $7450 for 2110 shares, to prevent your 1000 units share dilution

If SIA draws from the additional $6.2B MCB, you will be entitled to another
- 295/100 x 2500 = 7375 MCB rights @$1 (converted to 1523 shares)
Total additional cost to you = $7450 + $7375 = $14825 for (2110+1523=3633 shares)

I don't know how many shareholders will subscribe to this. It sounds like an expensive investment to ensure SIA's survival.

Assuming SIA maintains its dividends of $0.30/share, here's how your investment will pan out if you spend or don't spend that $7450 (with the upper limit being $14825).

If you don't spend $7450 (or $14825),
Best case - MCB is fully redeemed, dividend will be $0.30 x 0.4 = $0.12/share
Worst case - $9.7B MCB is not redeemed, dividend will be $0.30 x 0.239 = $0.0717/share
If you bought SIA shares at a peak of $16 back in the good old days, your dividend yield will become 0.0717/16 = 0.4%
Or if you bought it at $11, your yield will be 0.0717/11 = 0.65%
of at $6, yield = 0.0717/6 = 1.2%
And this is assuming dividends are maintained. If dividends are slashed by half, then your yield will also be halved, which means... I think you know how to halve it.

If you spend $14825 (why I say this is because you either cut losses and don't spend anything or you spend to maintain your share)...
Best case = Worst case = you still get $0.30/share if dividends are maintained.
If you bought at $16, yield = 0.30/16 = 1.9%
If you bought at $11, yield = 0.30/11 = 2.7%
If you bought at $6, yield = 0.30/6 = 5%

If the yield is 2%, it means you have to hold 50 years to break even... 1% yield breaks even in 100 years!

Is there a way to still invest in SIA? Probably... Buy if prices fall to $3?
If I spend $3000 to buy 1000 units, subscribe to rights and MCB at $14825, and then pray hard that dividends are maintained at $0.30, for a yield of 10%. If dividends are halved, yields drop to 5%.

Or maybe sell and cut losses now and buy again at lower prices? Assuming after all the dilution, SIA is still a darling demanding a 2% yield, dividends maintained,
if 2% - $0.0717/share / 2% = $3.60/share
if 4% - $1.79/share
if 6% - $1.20/share

if dividends are halved,
2% - $1.80/share
4% - $0.90/share
6% - $0.60/share

So will I buy SIA? Not anytime in the near future.

If I happen to have SIA shares, which I don't, I will put my $14825 in a good REIT which will easily pay me more than what SIA can possibly pay me in the next 10 years. If I am lucky with a 10% yield, like the days AIMS REIT fell to $0.90/share (yield 11%), I may even get my capital back in 9 years, without having to hope that SIA redeems the MCBs.

Monday, October 28, 2019

Stock Review: Hongkong Land Holdings

I have been eyeing on Hongkong Land Holdings for a long time, since the US$7-8 days. As property prices go up, up and away, I just look and drool, waiting for the opportunity. This year, the opportunity presented -- HK protestors wreck investor confidence, causing many HK shares to fall 10-20% in the past 6 months.

HK Economy

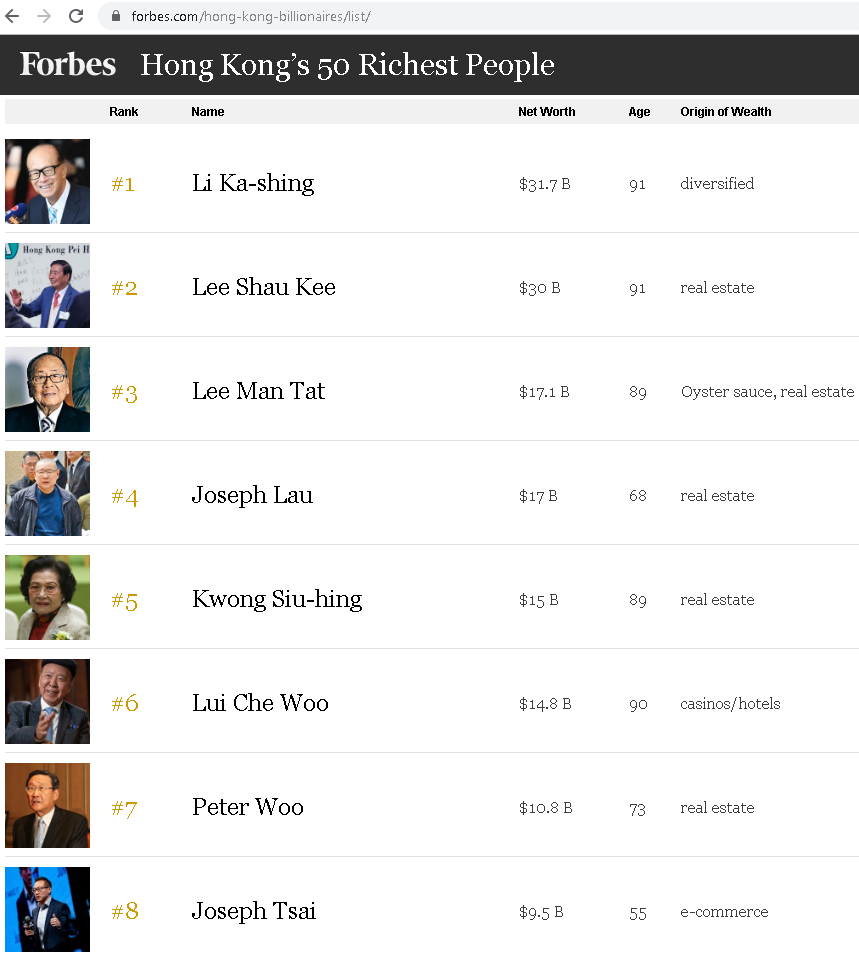
Normally, when you see a few cockroaches coming out of the kitchen, you know that there are a lot more to come, and we should expect volatile movements for an average of 1.5 years. At this point, my gut feel is that the protests are manifestations of deep underlying issues in how the society has divided the rich and poor. They don't have a wealth equalisation mechanism to uplife the poor, and the property-rich moguls control a lot of real estate and the government only provides rental housing for the really poorest of poor. Many younger workers "sandwiched" in-between are forced to buy either expensive property built by companies owned by these billionaires or rent from the many millionaires. If there are going to be any reforms, it will just be the beginning of a new era, and any equalisation will probably take a generation to take effect. In the meantime, the rich will just continue to get richer and for any aspiring investor, these billionaires are real examples of the effects of compounding. You can peek into forbes list of HK billionaires.

I am generally confident that property prices won't drastically fall suddenly because it takes a lot of stars to align for that to happen, but systemic issues can cause property prices to fall over 20 years, and this is the scary part, because you may not notice it, and by the time you notice it, you will realise that you didn't earn anything. The key metric I look at is population growth. Population growth is the main driver for economic growth. However, at a certain point, if the growth outpaces the infrastructure growth in the country, the country will be unable to support and will need to pause the growth, catch up in infrastructure (land expansion, utilities, transport, housing) investment, deal with a bit of oversupply issues, then let population grow again. You can see this being played out when you plot the growth rate over time.


In this chart, HK and Singapore's growth rate goes in cycles. Since 1997, HK's growth has been between 0-1%. I interpret it as infrastructure has been under stress to support the population for 20 years. How do we know if the government is doing its job in infrastructure investments to support population growth? I look at the population density metric.


In this chart, the year where the two lines crossed is 2007. When I see this, all things equal, I don't know what the future will be, but I can infer that the Singapore government is doing a lot more to support the population growth, i.e. chiefly land expansion. This also means that Singapore has a higher chance of over supply issue than HK. If you already hold properties in Singapore and HK, it's likely that the capital appreciation in HK is faster because the supply is increasing at a slower pace in HK. I won't want to invest in a Singapore residential property at the very least.

How all these can play out in an extreme scenario is where the poor in HK move to cheaper cities in China, much like how the poor leave the expensive cities in the bigger countries such as US and Canada. However, whether they get to live in more human conditions (as opposed to toilet-sized homes) is something I don't know because theoretically, they could have left HK to leave in a cheaper place, but they probably feel that HK is their home and refuse to move. Hypothetically, if HK had been a China all the while, the people would have behaved more like a US citizen shifting from expensive Manhattan to cheaper Texas, and still feel at home. In any case, expensive cities typically become more and more expensive over time. HK is a city, and not a country, so it's really not easy for their economy to crumble. On the flipside, an oversupply issue can be a massive drag on Singapore's economy.

Hongkong Land (HKL)

So I am confident of the HK economy, and I will get into the financials of HKL. HKL has 2 sources of income, rental (investment) and development sales. Development sales is something hard to value because income recognition will be lumpy, so I will not go too deep into it. I will just value the rental income aspect, and treat the development sales income as a bonus.

First, I want to know what's the proportion of "recurring investment income", so I will add the rental income and income from associates. This is the stable part of income that I know can be retained by the company or paid out as dividends.

In 1H2019 financial report  (page 11 of 21), rental and service income was US$509.6M + US$75.3M = US$584.9M. Operating profit for investments (rental) was US$482.6M. I deduce rental expenses to be 17.5% (1-482.6/584.9). In 1H2018, the equivilent was 19% (1-456.6/(484.1+76.4)). Associates contribute US$127.2M.

Recurring investment income for 6 mth = operating profit for investments + associates income - finance expense - operating costs
= 482.6M + 127.2M - 59.4M - 334M
= US$216.4M

as a % of profit before tax (page 5 of 21) = 216.4M/537.7M = 40%

In reality, the expenses will be lower because I took the whole figure, which include the costs for the development sales. There was no breakdown available in the financial report. This is a conservative calculation, but it means 40% of income is recurring in nature. Its income is also fairly stable as the vacancy rates are between 1-3%.

Next, I want to know if this income can sustain the dividends paid out.

Dividend paid out in 2018 = 16 cents/share = US$373.4M (page 14 of 21)
Recurring investment income for 12 mth - 17% corporate tax = 216.4M x 2 - 17% = US$359M.

17% is a conservative rate too. This should be lower as they will have deductibles. Debt to Equity is 9-10% which means dividends are not paid out of debt. I am inclined to believe that the dividends are sustainable.

Next, I want to know the Return on Asset, which is how much juice the company can squeeze out of its assets, which is like the yield on assets, or rental yield. Unfortunately, HKL doesn't publish its cost price, so we can't calculate a yield on cost.

Investment asset value = US$33,815.4M (page 7 of 21)
Associates asset value = US$7,152.5M
Total = US$40,967.9M
Net Return on Asset = 216.4M x 2 / 40,967.9M = 1%
Gross Return on Asset = (482.6M + 127.2M) x 2 / 40,967.9M = 3%
Gross Return on Asset (property only) = (482.6M) x 2 / 33,815.4M = 2.85%

The net Return on Asset is actually quite low, but this is not the real yield on cost, which should be lower especially if the properties were bought long ago. This is the yield based on current market value, so I interpret this as the properties market value are overvalued, because 1% is lower than safe bond rates of 1.5%-2%. If we assume property valuation to fall to a safe bond rate of 2%, this means we can expect the investment values to reduce by 50%. If we expect safe bond rates of 3%, we can expect the investment values to reduce by 33%.

Finally, I want to know the Price to Book value, but I want to be more conservative and calculate an adjusted book value, and not use the book value calculated by the company which uses current market values of their investment properties. I won't want to just apply a discount rate to the NAV because in the event of a market crash, the assets will half in value, but the loans will remain at 100% and won't be halved.

Net asset value (NAV) per share = US$16.50 (page 1 of 21)

NAV = US$38,529M (page 7 of 21)
Number of shares = 2,333.9M (page 13 of 21)
My adjusted NAV = US$38,529M - 50% of (investment properties, joint ventures, properties for sale) - debtors = US $38,529M - 50% x ($40,967.9M + $2,065.8M) - $985M  = US$16,027.15M
My adjusted NAV per share = US$6.87

Price to my adjusted NAV = 5.40/6.87 = 79% (i.e. 21% discount)
Price to unadjusted NAV = 5.40/16.50 = 33% (i.e. 67% discount)
[30 Oct Edit: Discounted joint ventures, properties for sale, debtors into the adjusted NAV to reduce the NAV further]

Valuation

If I assume a value buy to be at the cost of 60% of the asset values, the max price to buy is 60% of US$6.87 = US$4.12.

At last done price US$5.40, US$0.16 dividend = 0.16/5.40 = 3% yield

HKL will be an asset play as there is a discount. The % varies, depending on how you value their assets. The dividends are so-so, however if market depresses the market price further to US$4.12, all things equal, it turns into a dividend play at 4% yield, with a margin safety of -50% discount to market value for its investment assets.

The last done price was US$5.40, which is attractive enough for me, so I should be nibbling some in the coming week.

The writer does not hold shares in HKL.

Friday, March 22, 2019

Stock Review: SIA Engineering

SIA Engineering (SIAEC) is a company providing aircraft maintenance services. I have been a shareholder of SIAEC for a few years but I had not really read their financial reports in detail. There are 3 reasons why I bought their shares, in order of priority:
  1. High barrier to entry -> Economic Moat
  2. Very low staff turnover -> Human Capital Moat
  3. No debt, net cash -> Financial Moat
Unfortunately, its share price had been falling ($5.10 in Jul 2014) and falling ($3.80 in Sep 2016) and falling ($2.90 in Nov 2018) and falling ($2.20 in Dec 2018)... now $2.40. I wonder if there are problems with my 3 reasons.

Economic Moat

Every quarter, SIAEC had been reporting decreased in revenue, due to new planes that require fewer (fewer engines (from 4 reduced to 2) and higher mileage between servicing intervals) and shorter (improve designs and technology) servicing, which is a good thing if you think about air travel as a whole, because planes are safer and turnaround times are shorter. This means that airlines with newer planes will spend less on maintenance, which is bad for SIAEC. The good thing for SIAEC is that there are also more planes now because planes have become cheaper to acquire and maintain.

While aircraft checks have become fewer and shorter, I believe that the complexity has increased. This is because software is likely the enabler for these hardware improvements. This means that a maintenance engineer has to also learn how the software controls the hardware, in addition to all the new planes and the constant software updates these planes receive. As the servicing interval is further apart and maintenance window shorter, a maintenance engineer also needs to have a lot more experience to rectify problems and also identify potential issues in a shorter duration. SIAEC is in a very specialised area of business and this gives it its economic moat. It's very unlikely you will see another competitor beyond the existing one -- ST Engineering -- which mainly deals with military aircraft maintenance.

As long as aircrafts are in use, there will be a demand for aircraft maintenance services. This moat should still exist for a while..

Human Capital Moat

Being so specialised, SIAEC will likely have recruitment issues because staff can only come from a similar aircraft maintenance company based outside of Singapore, ST Engineering, military, or university/polytechnic graduates. Salaries also need to be higher. The good thing is they have very low staff turnover of 2%. If you are an aircraft engineer seeking a job switch, then you either join the defence/aviation government agencies, or pre/post/sales teams of Boeing/Airbus/Rolls Royce/similar in Singapore, or leave Singapore to join a similar company elsewhere. The community is small.

At 2%, I think it's a very good indicator that their engineers are well looked after. This is very important because the quality of services delivered depends on them. The only risk is potentially retirees leaving over the next few years, but this risk is present in every company in Singapore, because of the baby boomers generation. It just has a greater impact for companies dealing with very specialised products and services.
SIAEC Annual Report 2017 Page 29

Financial Moat

SIAEC has no debt throughout the years, which is good, but you may wonder if they are overly stingy with investments (~$30M in capex and intangible assets, 3Q18, pg7). Unfortunately, it's not stated what these investing activities are, but we can guess that it is around robotics, automation, and new toys they are trying out. Their Dividends from investments ($85.7M, 3Q18 pg7) = 2 x Net cash from operating activites ($39.8M, 3Q18 pg6). (I am dreaming of the day where my dividend from investments = 2 x my employment income too...). These numbers suggest really frugal and long-term financial management, which is something I really like about them.

Valuation

Net profit margin was 14.6% for 9 months ending 31 Dec 2018, compared to 16% a year ago. This was calculated with profit attributable to owners of parent / revenue. To me, it's a close enough figure to show that they are keeping a close watch on expenses too. Usually for companies that rely on human capital to deliver services, drops in revenue eat into profit margins, so it's important that the margin isn't too lean (i.e. <5%) and doesn't change too much (i.e. >5%).

At $2.40, it is just a little higher than its historical low of $2.20 on 26 Dec 2018. A dividend of $0.12 may not be too much to ask for, although the market is likely pricing in a lower dividend of $0.10 (because historically, SIAEC's yield hovers around 4%).

To determine what price to buy at, you ask yourself how badly you want to buy, and how much margin of safety you want to have. Assuming a lower dividends gives you a higher safety margin. If you want it badly, you just buy regardless of the price, like what I did. And if you like it so much, you buy more every time the price falls 10%.

$2.40, $0.12 dividend = 5%
$2.40, $0.10 dividend = 4.1%
$2.20, $0.12 dividend = 5.4%
$2.20, $0.10 dividend = 4.5%

I may be blinded by my vested interest in SIAEC, but I still like their moats.

Saturday, March 2, 2019

Stock Review: Hyflux's Restructure Plan to erase $3.3B unsecured debt

If you need a summary of the Hyflux re-organisation process, you can read the FAQs at Hyflux website and Q&A from Second Townhall Meeting with Holders of Perpetual Capital Securities and Preference Shares .

Key points extracted, words in square brackets added by me:

[Internal Factors:]
  1. While the Group reported losses in 2017 for the first time in its history, it had also regularly kept the market abreast of its plans to divest the Tuaspring project as well as its discussions with potential strategic investors.
  2. [Unsuccessful Tuaspring sale]
[External Factors:]
  1. Tuaspring was the largest asset Hyflux has invested in. In line with the business model, Hyflux sought to divest Tuaspring about a year after the power plant started operations in March 2016. Unfortunately, at that time, the poor market conditions hindered the divestment efforts.
  2. The oversupply of gas in the Singapore market resulted in depressed electricity prices which adversely impacted Tuaspring’s financial performance when it started operating. The average wholesale electricity price in 2016 (when Tuaspring power plant started operations) was at $63/MWh, compared to $220/MWh in 2011 (when the project was first awarded to Hyflux). [Main reason, like how certain US oil companies went bankrupt when oil prices fell 80% because they priced projects based on best case scenarios and were over leveraged.]
[Unsuccessful Tuaspring sale]
  1. The effort to divest Tuaspring started in January 2017.
  2. DBS and CICC Bank were appointed as advisors for the divestment exercise.
  3. By August 2017, more than 50 parties had indicated an interest in Tuaspring and had been provided access to the information memorandum concerning Tuaspring following written approval to disclosure being received from PUB. This information memorandum provided high level information on the asset.
  4. As a result of this exercise, the company received several preliminary non-binding bids, all of which were subject to agreement on the investment structure, regulatory and other approvals, and completion of detailed due diligence. Three of these indicative bids attributed an enterprise value of S$1.4 bn to the Tuaspring project. [Entreprise value isn't asset value; it's the sum of how much it will cost to buy over the plant.] These came from a PRC SOE, a private UAE party and a subsidiary of a Singapore listed company.
  5. However, these numbers were not final but subject to various conditions, investment structures and further due diligence.
  6. To conduct further due diligence (which required obtaining access to more confidential information relating to Tuaspring) and to make a binding offer, an interested party needed to be approved by PUB to be granted access to such confidential information.
  7. By May 2018, none of these parties had completed their due diligence processes, and the time required to complete such due diligence and receive an offer was likely to take a much longer period of time. With the weak electricity market not likely to recover in the near term, the Group will continue to suffer losses. As such, Hyflux decided to commence a transparent financial reorganisation supervised by the High Court of the Republic of Singapore.
  8. The effort to divest Tuaspring continued in July 2018 through a collaborative sale process with the sole secured bank lender, Maybank.
  9. Of the parties that had expressed an interest previously, only 8 requested to be pre-qualified by PUB.
  10. Of the 8 parties, only 2 local parties [Keppel Corp and Semb Corp] were pre-qualified by PUB, of which 1 submitted a conditional bid [Semb Corp] in early October 2018.
  11. This conditional bid would have been insufficient to repay Maybank. [Maybank's loan = $700M ]
  12. Maybank agreed to extend the relevant deadlines for the collaborative sale process but to-date no further offer has been received from the other pre-qualified local party.
  13. No further request for pre-qualification has been made by any other interested party nor have any other offers been received.
  14. The Board is duty-bound to consider any offer that is made and compare that against the proposed investment by SMI.
  15. At present, the best option in all the circumstances, is the proposed investment by SMI. Before the scheme meeting on the proposed investment at the end of March 2019, the Board will consider any better offer that is received. To-date no other offers have been made.
  16. Please also refer to the SGX announcement issued by Hyflux on 28 January 2019 regarding the Tuaspring sale process and related news reports: http://investors.hyflux.com/newsroom/20190128_161822_600_P8YLNZWOKM8HC60B.1.pdf
How I read all these

How much unsecured debt is there? S$2.6B for Hyflux Ltd only or $3.3B including subsidiaries
Read the Scheme document for Hyflux Ltd Creditors. Summation is my own as the total isn't stated.
Items #1 to #5 appear in the financial statement Balance Sheet as Liabilities, $1.65B.
Items #6 to #7 appear in the financial statement Balance Sheet as Equities, aka off-balance-sheet-liabilities $1.8B.
  1. $572.1M - Facilities
  2. $136M - KfW
  3. $265M - Notes Series 8,9,10
  4. $668.1M - Contingent
  5. $11.3M - Other Trade Creditors
  6. $500M - Perpetual Capital Securities @6%
  7. $400M - Preference Shares @8%
  8. $72.3M - Subordinated Scheme
Page 193 states how $3.3B debt will be erased with SM Investments's $400M. Debt from the other 3 subsidiaries are stated too. That's 88% of debt magically disappearing from the books.


  1. Olivia Lum Volunteers To Contribute Her Entire Stake Of 267 Million Hyflux Shares And Securities Solely To The Other Holders Of Perpetual Capital Securities And Preference Shares As Part Of Restructuring Plan --> She could have also done this by selling Tuaspring to Semb Corp at say $530M too.
  2. Hyflux was following Singapore government’s instructions to prepare for 8 million population and industrial expansion. --> This means that Tuaspring isn't operating at full capacity, however, we have no visibility on the % utilisation, something like occupancy rate of a building you rent out.
  3. Maybank holds the secured debt backed by tuaspring at a value of $700M. They have the best bargaining powers now. --> Maybank still has hope to get back $700M because they are not part of the restructure plan.
  4. Tuaspring is operating at a $70M loss in 2016 (Hyflux response to SIAS letter Page 12, Q17) based on last audited accounts. In the restructure plan, nothing is mentioned about this, but we know that an indonesian tycoon will own 60% of it and ALL other Hyflux assets with $0 liabilities (because all will be written off)at a steal -- just $400M! Equivilantly valuing all assets at $400M / 60% = $667M.
1Q2018 Financial Reports
  1. Based on 1Q2018 reported $24M loss, Earnings Per Share was -4.53 cents (-1.82 cents in 1Q2017), or -1.57 cents (1.6 cents in 1Q2017) excluding Tuaspring. Based on 785M shares, Tuaspring's 1Q2018 loss was -2.96 cents/share (-3.43 cents in 1Q2017) or $23M ($27M in 1Q2017).
  2. $3.6B assets of which tuaspring is under asset-held-for-sale at $1.47B, $2.6B liabilities (of which $0.56B belongs to tuaspring).
Salim Smart

This is an awesome deal for SM Investments to own 60% of Tuaspring at a fraction of Semb Corp's offer. He deserves to be a tycoon. Assuming Semb Corp paid $530M, including $560M of liabilities, it would have paid $1.09B.

For Hyflux shareholders, the 785M units will be diluted 25 times. I hope I am interpreting this correctly from Page 193, that post re-org, ordinary shareholders own 4%. This also means that there will be approximately 785M x 25 = 19.625B units without shares consolidation.

In terms of paper value for 1 unit of Hyflux share post re-org, it's 3.4 cents ($667M / 19.685B units). Based on last traded price of 21 cents in May 2018, it's -84%.

For Perpetual Capital Securities or Preference Shares holders, not Hyflux shareholders, for every $1 owed to you, Hyflux will return you 10% in the form of 3 cents cash + 2.26 units of Hyflux shares (assuming 19.625B base, 19.625B x 10.38% / 900M = 2.26 units) supposedly worth 7.69 cents. If you have 10 units of shares (or $100/unit x 10 units = $1,000 worth), the restructure offer is to redeem your 10 units at $30 cash + 2260 units of Hyflux shares worth $76.90 instead of $1,000 cash.

Is there a better way out?

If I have the answer, I will probably be an investment banker, and not a nobody writing stock reviews? Here are my thoughts:

Firstly, Tuaspring's asset value should not have been stated as $1.47B. It should have been $1.47B - $0.56B = $0.91B. This can quite misleading in various contexts.

Secondly, the interest payments are suffocating. Although the interest rate for the bank debts were not stated, but we can assume it to be 5%, a bit lower than the 6% paid to retail investors, because usually banks aren't willing to lend, hence seek retail investors. 
If the $3.5B debt is re-negotiated
@5% = $175M/year
@2% = $70M/year

Personally, I think re-negotiating the debt @2% is one option, while they work on making Tuaspring profitable and then selling it off. Given the current stand-off situation, even if Hyflux offers @0%, I bet many creditors will choose 0% over the 10% redemption offer, similar to what Maybank is doing, hope for gas prices to go back up. 

Thirdly, if there is synergy between Tuaspring and Salim's businesses, then work on partnership deals to improve its profitability. I am not a Tuaspring expert, but minimally, I will think that scaling down operations is one way to cut cost. In addition, gas prices have fallen by two-thirds, so it won't be too unreasonable to re-negotiate the concessions with the government? I don't know.

The writer owns 130 units of Hyflux Preference Shares.

Monday, October 29, 2018

Stock Review: ISOteam

ISOteam Limited is a company that started out as painter that diversified its business over the years. It is Nippon Paint’s exclusive applicator of paint works for Repairs and Redecoration (R&R) projects for the HDB and Town Council segments, likely through its joint venture subsidiary TMS Alliances Pte Ltd.

The share price for this company had recently fallen a lot, because of fewer projects, reduction in suppliers' rebates (hence increased cost of sales) and increase in marketing expenses that ate into profits.


Extracted from presentation slides from 4Q2018, ending 30 Jun 2018
Business Model
65% of revenue comes from R&R and Additions and Alterations (A&A), which are rather labour-intensive. It's one of those things like a hair cut where you need hair cuts regularly and it can't exactly be automated. For hair cuts, the demand scales proportionally to the population. For R&R and A&A services, the demand scales with the number of buildings, which is correlated with the population and number of businesses. From this aspect, we can expect these services to remain in demand. Barrier to entry isn't high, but due to the labour-intensive nature of these services, new entrants will likely be smaller scale sub-contractors instead.

Nature of Expenses
As they spent $13M on their new corporate office in FY2017, the loans and depreciation expenses have just kicked in in FY18. Personally, I think that centralisation is good, considering that they had acquired many companies in the past few years and they likely had not consolidated their systems and manpower. Whether or not they can integrate everything together fast enough to control their expenses, I do not know, but the expenses do look prudent.

Net profit margin dropped to 0.9% in FY2018. I like it that this number was calculated and presented in the slides. Some companies that want to down play the decrease in net profit margin leave it to you to calculate it from the financial statements and just show you the gross profit margin. It will be good if they had stated how many years they used to depreciate their new leasehold property. It is also unknown if there are any old office premise currently parked under property assets that they will be selling away after they shift to their new office.

Extracted from financial report from 4Q2018, ending 30 Jun 2018, page 27 of 29


Extracted from financial report from 4Q2017, ending 30 Jun 2017, page 27 of 29

Earnings
Earnings per share is 0.66 cents. Dividend is 0.18 cents. Based on the last transacted price of 24 cents, it translates to Price Earning Ratio (PER) of 36 and Yield or 0.75%. This is awfully low and further price drops should be expected. The number of projects need to increase, or expenses reduced, in order for them to reap profits again.

References:


The writer owns shares in Isoteam.

Sunday, August 19, 2018

Stock Review: Singapore Airlines

I last reviewed SIA in Feb 2017. Prices have since went on a roller coaster ride and it's now $9.56, last done last friday. The lowest was $9.50 on 13 and 16 Aug 2018.


Profit Margin
Profit Margin is still lean, but an improvement from previous review,
FY17 = 892.9/15806.1=5.65%
FY16 = 360.4/14868.5=2.42%
Q12018 = 149/3844.5=3.88%
Q12017 = 346.5/3864.2=8.97%

Fuel costs have been rising and adding to costs. In 2016 and 2017, fuel costs form 25% of revenue.
FY17 = 3899.3/15806=24.7%
FY16 =3747.5/14868.5=25.2%
Q12018 = 1079.4/3844.5=28.1%
Q12017 = 925.7/3864.2=24.0%

Clearly, fuel costs ate into their margins in Q12018.

Return on Assets (= Net Income/Assets)
SIA is constantly buying aircraft. They boast a young fleet with average age under 5 years old. I chose to divide by the Property, Plant and Equipment figure as it is likely referring to the aircraft, instead of total assets, which includes other investments. For this calculation, I prefer to use the more conservative net income instead of operating profit because debt is used to finance the aircraft purchase.

FY17 = 892.9/19824.6=4.5%
FY16 = 360.4/16433.3=2.2%

Overall, it's still not an effective use of the aircraft, but I guess we can say that the new aircraft may be a draw for customers.

Dividend Sustainability
Free Cash Flow per share is even more negative now at -$1.03 in Q12018. Dividend payouts are funded by debt. Although they paid a dividend of 40 cents for 2017, a yield of 4.2%, I am not attracted to it. As a whole, SIA may have been watching their costs, but I just don't think their increasing debt is a good thing.


The writer does not own any SIA shares.

References:

Monday, July 23, 2018

Stock Review: QAF Limited

QAF Limited is a company owned by the late indonesian tycoon Mr Liem Soie Leong aka Soedono Salim who founded the conglomerate Salim Group. His youngest son Anthony runs Indofood Agri Resources, a palm oil producer. His second son Andree runs QAF as Vice Chairman, which has 3 business areas: bakery (e.g. Gardenia), primary production (pork produce, e.g. Rivalea) and distribution and warehousing (e.g. Cowhead, Farmland). Andree's son Lin Kejian runs QAF as Joint Group Managing Director. To see a more detailed listing of the brands they distribute, check out Ben Foods.

QAF ownership extracted from SGX Stockfacts
QAF has a long history (you can read a bit more about Wong Fong Fui who turned QAF's business around before selling it to Salim Group in 1996). The company focused on Gardenia bread and expanded their business from there. Bakery is still very much a core business for them.

Their share price has fallen from a high of $1.585 in Feb 2017 to the current low of $0.86 in Jul 2018, a drop of 46%. This is mainly due to a pork oversupply issue worldwide that started in the beginning of 2017 after China reduced pork imports.
QAF's share price over the past 10 years
So is the stock worth buying? The most important factor to assess is whether the business, excluding the affect pork business, is able to provide stable income for the company. There are many figures inside the financial report but I will drill into the earnings by segment.

Extracted from financial reports FY2017 and Q12018
References: 1Q20184Q2017

The earnings from primary production is about 30% in 2017. Although the 1Q2018 report didn't state the Earnings before income tax (EBIT), based on the proportion between EBITDA and EBIT for FY2017, we can expect the primary production contribution in 2018 to be lower than 30%. Earning per share (EPS) in 1Q2018 has reduced from 2.6 cents in 1Q2017 to 0.5 cents in 1Q2018. There was also a scrip dividend issue which diluted the shareholder base slightly (1.5%).

Assuming straight-line projection of earnings for the rest of 2018, i.e. 0.5 cents x 4 quarters = 2 cents, QAF is definitely not going to be able to pay its dividend of 5 cents/year, a track record which they have been maintaining for since 2012. There is no net profit per segment figure in the financial report, which I thought would be good if the management had included it. Anyway, we need a guess-timate, so we just use whatever is available. Based on this, and assuming bakery's profit is constant, because the EBITDA figures say so, I estimate the loss from primary production to be $11M. The only problem is there is no way to tell whether this loss is a one-off or a recurring loss.

Extracted from financial reports FY2017 and Q12018
Ok, now to the valuation, if the business could be valued by the market at $1.585 at its peak, halving the price means that the market is expecting the primary production business to not contribute any income. As we have seen that the losses are actually eating into the profitable bakery business, this suggests that QAF's share price can fall further. My current average price is $1 and I will be holding on to these stocks as it has a good economic moat -- bakery and food distribution business, even if its pork business is out of business.

The pork oversupply issue is hitting US the hardest because China has imposed a 25% tax on US pork imports. Many australian pig farms have closed. Some may have to kill the pigs because there are no buyers and it costs money to feed them. The only reprieve will be if China is agreeable to take in Australian pork imports, however, this will take a while even if they start negotiations now. I am expecting QAF's price to remain volatile in the next 6 months until the market consolidates. My strategy is to just buy on dips to average down, barring any other unforeseen events like a full-blown trade war that sends everything crashing.

Saturday, March 24, 2018

Stock Review: If I were to pick a Retail Trust

I had not done a retail REIT comparison before, so I decided to do one. Here are the REITs that I selected.

  1. CapitaMall Trust (CMT)
  2. Capitaland Retail China Trust (CRCT)
  3. Mapletree Commercial Trust (MCT)
  4. Starhill Global REIT (Starhill)
  5. Suntec REIT (Suntec)
  6. Fraser Centrepoint Trust (FCT)
  7. SPH REIT (SPHR)
I wanted to compare the Singapore properties mainly, so I went through the financial statements and presentations to compile a table of key indicators I am interested in. These are, in order of priority,
  1. Net income/lettable psf - how much income after deducting expenses per square foot of lettable space, the higher the better because it means I can earn more for each square foot. I also deducted the adjustments on fair value of properties (unrealised paper gains on property value) which will unnecessarily boost the earnings because it doesn't translate to cash income.
  2. Overall profit margin - how much income per $1 collected, the higher the better because it means expenses are lower.
  3. Loan interest rate - the lower the better, because it shows how the banks and debtors are perceiving the riskiness of the business.
  4. Occupancy - the higher the better, because it shows that demand exceeds or matches supply. This helps to ensure that rentals can be held steady or increased.
  5. Dividend/Earning per share (EPS) - the lower the better because it shows that the properties are sitting on large unrealised paper gains on property value.
  6. Debt % - the lower the better
  7. Yield - the higher the better, but this needs to be compared with the other similar REITs because there is a premium to pay for steady and resilient businesses.
  8. Price to book - how much discount the price is to market value of the properties, the lower the better because it means I get to buy the properties cheaper, but similar to yield, there is usually a premium to pay for the steady and resilient businesses. 1 means fairly valued.
Comparison chart based on respective financial reports. May have data transposition errors, although I double checked most figures.
Overall, I like CMT the best mainly because of its high income/lettable psf, profit margin, 99.2% occupancy and dividend to EPS  I was half thinking why I didn't do this review earlier so that I can buy the stock at cheaper prices when REITs were having their great singapore sale.

My next favourite is SPH REIT, which I already own and this comparison re-affirms my decision. It's 100% occupancy (year after year) is what I like the best. Low debt is just a side kick. The rest doesn't really matter.

I will keep a watch on CMT and seek to add if prices recede closer to book value of $1.92.

Sunday, February 18, 2018

Stock Review: Singtel

Few years back, when Singtel prices were low, I wrote a review for Singtel in Sep 2015. I usually don't read every company's quarterly or financial report. It's a lot to read if I have to read 20 reports every quarter because I have about 20 different stocks. I usually only read up on companies which are on my shopping list and their prices are at 52-week lows, or below the past 5-years mean.

I reference Singtel's latest 3Q2018 report, i.e. 9 months ended 31 Dec 2017.

A recap of Singtel's business is that it has 3 lines of business -- Consumer (Telco), Enterprise (NCS, IT services), Digital Life and Corporate (which I will call it the rest, including rental income, start-ups, venture capital endevours), which contributes 77%, 23%, 0% profit before tax and depreciation (i.e. EBITDA on Page 31) respectively.

In the financial report, we aren't able to get a clear breakdown of telco EBITDA by geography because the report is grouped at a high-level as 100% owned and non-100% owned. Singtel and Optus are 100% owned, so the number is reported together. For the remaining telcos, they are like investments made by Singtel and the financial report itemised them and also allow you to calculate the Return on Asset for these investments. The profit (i.e. EBITDA minus depreciation, tax) by geography is available in the 2017 Annual Report (AR2017 data is 9 months old).

Data extracted from 3Q2018 Page 31
Although Airtel is not giving a good return, returns from Indonesia, Philippines and Thailand are good.
Screen shot from AR2017 Page 2
Income stream remains well-diversified with 70% of income sourced outside of Singapore. What could have caused Singtel prices to fall (and continue to fall) are possibly the reduced income from Airtel because Airtel is facing regulatory demands to the tune of S$3.75B (Page 28). To me, the worst case scenario is no dividends from Airtel, let's assume S$276M/year less profits. AIS (Thailand) is also facing regulatory demands of S$1.11B. Let's say we assume the worst case scenario of no dividends from AIS, then S$337M/year less profits. In 2017, net profit was $3.853B (AR2017 Page 6). If we assume worst case scenarios of 0 income from Airtel and AIS, S$3.24B and 16,344,561,000 number of shares (2Q2018 Page 20) translates to Earnings Per Share (EPS) of 23.96 cents (AR2017 Page 110) to 19.8 cents. This should not have any impact on Singtel's ability to pay 17.5 cents of dividends.

In terms of competition from the 4th, 5th, 6th Telco in Singapore, I don't think there will be much impact as these telcos will still need to rent the lines/bandwidth from Netlink Trust or existing telcos Singtel/M1/Starhub. These new players will also keep Singtel on its toes to keep cost low and retain their customers, which a definitely a good thing. The least we want is complacent monopoly giants.

In 3Q2018 Management Analysis Report, we can read some management comments. Usually management statements such as these are made together with the financial statements. Singtel separated it as a separate document probably because they furnish a lot more information than other companies would, which I like. I like their transparency, and it shows that they are also facing competition head on.

The report explained that the decrease in profit is mainly due to reduced profits from Airtel and reduced income from Netlink Trust as a result of selling Netlink Trust when compared on a year to year basis. Reduced income from Netlink Trust is expected to be seen in every quarterly report from Jul 2017, we will see this quarter-on-quarter reduction in another 2 more quarterly reports. I am personally not concerned with this because Singtel profited from the sale of Netlink Trust and lowered their debts as a result.

Debt was reduced from S$9,354M (D/E = 23.8%) to S$8,551M (22.5%). Debt/Equity (D/E) ratio is a measure of how much debt the company has as a percentage of shareholder value and retained earnings. ~20% is a good number. Singtel probably used the Netlink Trust sale proceeds to lower their debt, which is a good thing.

Singapore mobile revenue is 19% of overall revenue (Page 8). If there are worries about the competition in Singapore, M1 and Starhub are the ones who will face stiffer competition than Singtel because Singtel is the elephant in the room with 48.9% prepaid and postpaid market share (Page 53). In terms of debt, Singtel's debt is a lot lower than M1 and Starhub's. I have more details on the debt comparison in Stock Review: M1.

As at 31 December 2017, NCS’ order book increased by 25% to S$2.9 billion from a year ago (Page 33). There is no further elaboration of this, but these increases in revenue should be recognised in the next few years, and won't be immediate as IT projects typically have 1-2 years of implementation time.

Assuming a 17.5 cents dividend, at Singtel's last closing price of $3.33, it translates to a 5.25%. This is a very good yield for Singtel, considering how big an economic moat it has, diversed income streams, and stable dividend yield track record.

Major shareholder - Temasek - I bet they won't sell their stake in Singtel. It's anyone's guess how much lower prices will go. The previous low was $3.10 in 2011 but circumstances are very different now. It was $4.40 a year ago and how different were circumstances? The price has a history to have cycles and as long as we buy at the lower ends, we will have a higher margin of safety (to go wrong and make a loss). If you have extra cash, you can buy more and sell some away when the prices go up. For me, I am happy with a 5% yield.

Screen shot from AR2017 Page 230

The writers owns Singtel shares.

Wednesday, November 8, 2017

Stock Review: M1

Earlier on when M1's price was hovering around $2, I briefly calculated a price tag of $1.75 before I will do a more detailed review of M1's financial report. I just assumed no dividend at year end, hence whole year dividend of 11 cents, -20% discount to factor in -20% YoY decline, divide by 5% yield and arrived at 11 x 0.8 / 0.05 = $1.76.

On 11 Aug 17, the lowest price was $1.705. Prices have been hovering around $1.78, but I think it's time I write a review. High tide floats all boats and the market is at a high tide now so I am ignoring market prices.

In M1's 3Q2017 report, the concluding sentence was "Based on current outlook and barring unforeseen circumstances, we expect a decline in net profit after tax for the year 2017."

"Net profit after tax declined 4.8% year-on-year for third quarter and 13.9% year-on-year for 9 months ended 30 September, 2017. This is in line with our previous outlook statement." -- From here, I think it's safe to assume that it will decline 20% YoY.

9M2017 EPS  = 10.9 cents. assuming straight line decline, annual EPS should be 14.5 cents.

Assuming a payout ratio of 90%, which is the lower end of M1's historical payout ratio, dividend for 2017 = 13 cents.

Assuming 2 more years of consecutive 20% YoY decline,
2018 EPS 14.5 x 0.8 = 11.6 cents
2019 EPS 11.6 x 0.8 = 9.28 cents

Apply payout ratio of 90%, 9.28 x 0.9 = 8.352 cent

5% yield = 8.352 / 0.05 = $1.67
6% yield = 8.352 / 0.06 = $1.39

This is the extent of the margin of safety you can get at lower prices.

Two things were neatly hidden in plain sight which a casual reader will probably miss out.

1. Debt appeared to be downplayed. "Gearing ratio" is a technical term which casual readers will miss. It is calculated by dividing Total Debt by Total Equity. Total Debt is how much the company has borrowed. Total Equity is how much capital and retained earning over the years. When retained earnings is high, it shows that the company has been successful in accumulating wealth. If the company always pays out 100% of earnings as dividends, then $0 goes into Equity. Imagine you have $10,000 in your savings and I lend you $60,000 as unsecured lending (not backed by anything like your branded handbag or gold ring), your gearing ratio is 6 times, and I run a very high risk of not getting my money back because you only have $10,000. 

Interest coverage ratio shows the ability of the company to pay interest expenses with earnings - the higher the better - they were in a better position in 2016 because earnings were higher. Imagine you have a fixed interest expense, and your salary is decreased 20% YoY, then you will find it harder to repay. Usually you need to pay the interest to keep the loan active so that your bank will not force you to sell your assets to raise money.
9M2017 Page 20 of 22 Gearing and Interest Cover
However, this will probably not concern you if you are a shareholder of Starhub because Starhub's gearing ratio is much higher at 6 times. Just for comparison, I had calculated Singtel's gearing ratio too. Just as an illustration, REITs have a gearing ratio of around 30% to max 45%, so you read it in REITs presentation slides as 0.3x or 0.45x.
Accurate as at date of data extraction on 8/11/17
2. There is also a CAPEX item - spectrum rights - that will likely be recorded in Q4 and beyond. The report did not mention how they will fund the purchase, be it cash or loan. When reconciled with the cash flow statement, nothing has been paid yet. 

9M2017 Page 19 of 22 - CAPEX and Commitments
9M2017 Page 3 of 22 Cash Flow Statement - spectrum rights not paid yet
Taking its debt and committed CAPEX into consideration, I am sitting out and will probably review again when the price hits $1.39.

Saturday, August 26, 2017

Stock Review: Singapore Press Holdings (SPH)

SPH closed at $2.76, around its 5-year low. After SPH announced its drop in earnings every quarter, SPH will fall by about 20 cents. The drop became sharper after 31 Jul when it was announced that Ng Yat Chung, ex-NOL CEO, would become the SPH CEO wef 1 Sep 2017. Neptune Orient Lines (NOL) was sold to France CMA CGM and majority shareholders probably lost money.

Many people remember Ng for the wrong reasons, so any price drops beyond fundamentals are good opportunities.

Earnings per Share and Dividends
In Q3 financial report, ended 31 May 2017, YTD Q3 (i.e. Q1+Q2+Q3) Earnings per Share (EPS) is 8 cents, compared with 12 cents in 2016. Earnings for Q4 is expected to be higher due to recognition of 701 Search divestment gains, which will bring the EPS up to (estimated) 16 cents.
Extracted from SPH Q3 Financial Report page 24
Dividends had been steadily falling, from 24 cents in 2012 to 18 cents in 2016. Meanwhile, prices had been mostly kept above $4 earlier, in 2016, SPH spent most of its time around $3.50. (See Annual Report 2016) Dividend payout ratios had been exceeding earnings, which means SPH has been digging into its savings. I disagree with payout ratios above 90%, so my estimated upper cap on the dividend payout based on estimated EPS is 16 x 90% = 14.4 cents (@5% yield = $2.88). If I were a bit more conservative, I will estimate the dividend as 12 x 90% = 10.8 cents (@5% yield = $2.16). 12 cents as EPS is assuming there is no divestment gain.

Extracted from SPH Annual Report 2016
Income sources
As the media business is transforming, SPH can choose to reinvent media, or choose to close its media units and become a property developer. In any case, we don't have much control over what is considered their core business.

My re-representation of data from SPH Q3 Financial Report page 5

The good thing about SPH is that they hold valuable land assets (S$4B in value).
  • SPH REIT
    • Paragon
    • Clementi Mall
  • Seletar Mall
They have 2 condo development projects
  • Sky@eleven (2010)
  • Mixed commercial and residential project at Bidadari, next to NEL Woodleigh MRT (est. 2021)
Recurring SPH investments that I like
25 Aug 2017 - SPH will write-down S$31M in it's Mediacorp TV investments, following Mediacorp's decision to cease print edition of newspaper TODAY.

My views on SPH
When almost every analyst report recommends a sell on SPH, I am recommending a buy. I currently hold 200 units which I bought on a wimp at $3.90 in the 2015 market correction because they bought 20% stake of Mindchamps. I had since regretted hence had not added any. I will buy SPH at $2.76 as it's at a 5-year low and has a projected 5% yield based on a reduced annual dividend of 14 cents. The price might go lower, and my entry points will be every 5% to cover the 5% dividend opportunity. 
  • $2.76 - 2000 units
  • $2.62 - 1000 units (-5%)
  • $2.48 - 1000 units (-10%)
  • $2.34 - 1000 units (-15%)