Hug money and hold tight for a mini roller coaster ride. I will still be recommending the same stock this month.
1. SPH REIT* $0.93, 5.9% yield. 5.5 cents/share. If you buy 3,000 units, you can expect to get $160/year. Pros: Easy to visit Paragon and Clementi Mall to see how the shopper crowd is like.
Read the financial statements before putting your money on any stocks.
The above is by no means a fail-proof recommendation to buy. Stock prices fluctuate and buyers need to be aware of the risks.
The writer owns stocks marked *.
Thursday, May 12, 2016

Tuesday, April 26, 2016
Stock Review: Keppel DC REIT
Keppel Data Center (DC) REIT's financials look decent. Debt ratio of 30%, average lease expiry is 8.7 years, loan rates are fixed at 2.4%, occupancy 92%, etc.
What is holding me back from buying Keppel DC REIT? (I applied for it during the IPO but did not buy any post-IPO as I thought that the price does not offer me sufficient margin of safety. 7% is so-so, 6% is not high enough...)
1. Lease expiry
When you look deeper into the distribution of rental income vs lease expiry, 66.8% of the leases are 2.3 years, which is very short. In terms of distribution of rental income vs tenants, 62.1% belong to internet enterprises and IT services. My rough guess is that the 62.1% of tenants form the majority of the 66.8% short leases.
2. Demand and Supply
Keppel DC REIT appears to suggest that the growth in global data centre traffic (which is something like internet traffic) will provide the demand for data centres. To me, there are certain assumptions for this correlation to hold true:
If you believe in those assumptions, then perhaps the growth in data centre traffic will indeed continue to contribute to the demand for data centres. Personally, I feel that the size of servers is already shrinking at a very fast pace. For example, if we need to use 5 server racks 5 years ago, we can easily get the same computing power with a fraction of a server rack today. (This is purely based on my own observations which will need to be further validated to be believed.) As servers become more energy and space efficient, data centre space (physical space which is what Keppel DC REIT is about) requirements will definitely be reduced. Global data centre traffic can grow, storage requirements can grow, and data centre requirements can still be reduced at the same time if any of the assumptions I stated above suddenly become irrelevant.
3. Valuation model
The valuation of the data centres assumes that the space is worth a 1000 times more than the raw cost of renting the physical space (at industrial REIT rental rates) because of the specialised manpower and equipment required to manage the data centre, and high barrier for entry because of the high capital investment required.
While this is probably the best valuation method now, we need to remind ourselves that this method of valuation is not an assurance of its asset value. In the container shipping industry, we had seen how software and machines automated the entire sorting and movement of containers. Ships that were valued based on the pre-automation days of specialised manpower rates become overvalued. In telecommunications, we had seen how cable TV had become obselete in a matter of 20 years. If the coaxial cables were valued based on the cable TV subscription fees then they would be not worth anything now because fibre cables had fully replaced the network infrastructure.
Telecommunications as an industry will not disappear because people still need to communicate. Data centres businesses will not disappear too because people still need the infrastructure for internet applications. We just need to ask ourselves how much we are willing to pay as an income/value/growth investor. As an income investor, I will expect a minimum of 8% yield to consider an entry. I personally do not see any growth or value in this, so ask someone else about that.
References:
What is holding me back from buying Keppel DC REIT? (I applied for it during the IPO but did not buy any post-IPO as I thought that the price does not offer me sufficient margin of safety. 7% is so-so, 6% is not high enough...)
1. Lease expiry
When you look deeper into the distribution of rental income vs lease expiry, 66.8% of the leases are 2.3 years, which is very short. In terms of distribution of rental income vs tenants, 62.1% belong to internet enterprises and IT services. My rough guess is that the 62.1% of tenants form the majority of the 66.8% short leases.
2. Demand and Supply
Keppel DC REIT appears to suggest that the growth in global data centre traffic (which is something like internet traffic) will provide the demand for data centres. To me, there are certain assumptions for this correlation to hold true:
- Size of servers remain the same
- Servers will still be in existence and will not be overtaken by a newer breed of hardware (much like how servers overtook mainframes 20 years ago)
- No consolidation of server infrastructure across the globe (hence demand keeps growing)
- Wired network infrastructure will still be in existence and will not be overtaken by a newer wired/wireless/satellite technology (much like how copper wires were replaced with eternet cables 20 years ago and then fibre cables 10 years ago)
If you believe in those assumptions, then perhaps the growth in data centre traffic will indeed continue to contribute to the demand for data centres. Personally, I feel that the size of servers is already shrinking at a very fast pace. For example, if we need to use 5 server racks 5 years ago, we can easily get the same computing power with a fraction of a server rack today. (This is purely based on my own observations which will need to be further validated to be believed.) As servers become more energy and space efficient, data centre space (physical space which is what Keppel DC REIT is about) requirements will definitely be reduced. Global data centre traffic can grow, storage requirements can grow, and data centre requirements can still be reduced at the same time if any of the assumptions I stated above suddenly become irrelevant.
3. Valuation model
The valuation of the data centres assumes that the space is worth a 1000 times more than the raw cost of renting the physical space (at industrial REIT rental rates) because of the specialised manpower and equipment required to manage the data centre, and high barrier for entry because of the high capital investment required.
While this is probably the best valuation method now, we need to remind ourselves that this method of valuation is not an assurance of its asset value. In the container shipping industry, we had seen how software and machines automated the entire sorting and movement of containers. Ships that were valued based on the pre-automation days of specialised manpower rates become overvalued. In telecommunications, we had seen how cable TV had become obselete in a matter of 20 years. If the coaxial cables were valued based on the cable TV subscription fees then they would be not worth anything now because fibre cables had fully replaced the network infrastructure.
Telecommunications as an industry will not disappear because people still need to communicate. Data centres businesses will not disappear too because people still need the infrastructure for internet applications. We just need to ask ourselves how much we are willing to pay as an income/value/growth investor. As an income investor, I will expect a minimum of 8% yield to consider an entry. I personally do not see any growth or value in this, so ask someone else about that.
References:
Wednesday, April 13, 2016
What will I buy with $3000 (Apr 2016)?
STI has been hovering around 2800 points and it's quite safe to buy income generating stocks at 5% yield or higher when you are not caught in an upturn wave. When income is generated, you don't really need to worry about whether the market is good or bad. It's similar to a hawker centre set up -- just because 99 stalls keep changing owners because business is bad doesn't necessarily mean that the 100th stall that constantly enjoys long queues of customers will be unable to make money.
1. SPH REIT* $0.95, 5.7% yield. If you buy 3,000 units, you can expect to get $160/year. Pros: Rental from Paragon and Clementi Mall are expected to be stable despite reports about retail shops closing down and high vacancy rates in a handful of Orchard district retail malls. The reasons why the units are vacant are probably why Paragon enjoys 100% occupancy -- location, location, and location.
2. Boardroom* $0.59, 5% yield. If you buy 5,000 units, you can expect to get $150/year. This company has 3 business areas: Secretarial services, depository services, business solutions. There are many similar companies (at least 50 companies) offering similar services except for the depository services where they help CDP with the shareholders registry. Whenever you buy shares, it has to be recorded somewhere, and the service is provided by Boardroom. If you look at its financial report, it has been consistently operating at positive cash flow. Profit margin is around 10%. The downside is that there is very little float in the public market (just 15%) and you will be just waiting for one of the 400+ shareholders to sell their shares to you. Limited upside.
Read the financial statements before putting your money on any stocks.
The above is by no means a fail-proof recommendation to buy. Stock prices fluctuate and buyers need to be aware of the risks.
The writer owns stocks marked *.
1. SPH REIT* $0.95, 5.7% yield. If you buy 3,000 units, you can expect to get $160/year. Pros: Rental from Paragon and Clementi Mall are expected to be stable despite reports about retail shops closing down and high vacancy rates in a handful of Orchard district retail malls. The reasons why the units are vacant are probably why Paragon enjoys 100% occupancy -- location, location, and location.
2. Boardroom* $0.59, 5% yield. If you buy 5,000 units, you can expect to get $150/year. This company has 3 business areas: Secretarial services, depository services, business solutions. There are many similar companies (at least 50 companies) offering similar services except for the depository services where they help CDP with the shareholders registry. Whenever you buy shares, it has to be recorded somewhere, and the service is provided by Boardroom. If you look at its financial report, it has been consistently operating at positive cash flow. Profit margin is around 10%. The downside is that there is very little float in the public market (just 15%) and you will be just waiting for one of the 400+ shareholders to sell their shares to you. Limited upside.
Read the financial statements before putting your money on any stocks.
The above is by no means a fail-proof recommendation to buy. Stock prices fluctuate and buyers need to be aware of the risks.
The writer owns stocks marked *.
Saturday, March 19, 2016
Stock Review: Keppel Corp and Semb Corp Industries
I still have my holdings in Keppel Corp (KC, bought since 2 years ago, hence I am still sitting on thousands of paper losses, but will seek to reduce exposure depending on circumstances) but I had sold off my holdings in Semb Corp Industries (SCI, bought 3 months ago) last week for a small profit. I foresee eratic and depressed prices to persist and definitely would not recommend first-time investors to take this roller-coaster ride. This is my 3rd ride on the roller coaster (1st - 2009, 2nd - 2011) and every ride has been different. This ride seems to be longer than the earlier two as the fall in oil prices had fallen to a once-in-30-years low.
The key factor that I am watching at this point in time is "Inventories and Work-in-Progress" and "Trade and other Receivables" on the balance sheet. Receivables usually means work has been fully delivered. This is because KC and SCI both did their first write-off in years, which is probably the first sign of many more to come. To write-off "receivables" in their accounting mean they remove the payment amount from the "receivable" column and tell you that they do not think that they will be able to collect that payment. The trick to deciding how much to write-off also depends on how overdue the payment is (could be as old as one year or sometimes more). There is some benefit to write-off gradually over a few quarters because you pay less taxes and you can better manage your cash flow.
From the trend, receivables appear to be on an uptrend. The downtrend for KC is not to be taken as a good sign either because KC's management explained during the Q&A sessions that their projects with Sete Brasil (the brazilian company in a scandal and it at risk of bankruptcy) are still recorded under order books and not "receivables".
In terms of debt, both companies have been very stretched in the past 1 year. However, the large increase in KC's debt is largely due to the funding of the privatisation of Keppel Land in the start of FY15.
Overall, KC's balance sheet is riskier than SCI's as KC's inventories and receivables are much much more than its net assets (i.e. assets minus liabilities). However, this is also largely due to the large debt for Keppel Land. At this point in time, I had not seen any signs of how the privatisation of Keppel Land had helped the company.
SCI faces a higher concentration risk than KC. Sete Brasil contributes to 30% of SCI's rig-related order books and 20% to KC's rig-related order books. The amount SCI wrote-off was 3 times that of KC's. Taken in proportion to the inventories and receivables (charts shown earlier), the write-off effect is definitely bigger for SCI. Had it not been for the one-time divestment gains SCI made, the write-off could have made SCI's full year result in a net loss, like what happened to Semb Corp Marine.
KC, on the other hand, has investment income support that forms 25% of its recurring income, which is something built up over KC's lifetime. This to me, is a reflection of KC's management long-term investment focus and risk appetite, which is one of the main reasons why I have the faith to endure the long winter with KC.
Oh, and the dividend yields for KC are higher, so I am happy to get paid to ride this roller coaster.
The writer owns units of Keppel Corp shares at the time of writing.
References:
The key factor that I am watching at this point in time is "Inventories and Work-in-Progress" and "Trade and other Receivables" on the balance sheet. Receivables usually means work has been fully delivered. This is because KC and SCI both did their first write-off in years, which is probably the first sign of many more to come. To write-off "receivables" in their accounting mean they remove the payment amount from the "receivable" column and tell you that they do not think that they will be able to collect that payment. The trick to deciding how much to write-off also depends on how overdue the payment is (could be as old as one year or sometimes more). There is some benefit to write-off gradually over a few quarters because you pay less taxes and you can better manage your cash flow.
 |
| Trend of Receivables amount on the balance sheet |
 |
| Trend of Inventories and Receivables amount on the balance sheet |
In terms of debt, both companies have been very stretched in the past 1 year. However, the large increase in KC's debt is largely due to the funding of the privatisation of Keppel Land in the start of FY15.
 |
| Debt (leverage) ratio |
SCI faces a higher concentration risk than KC. Sete Brasil contributes to 30% of SCI's rig-related order books and 20% to KC's rig-related order books. The amount SCI wrote-off was 3 times that of KC's. Taken in proportion to the inventories and receivables (charts shown earlier), the write-off effect is definitely bigger for SCI. Had it not been for the one-time divestment gains SCI made, the write-off could have made SCI's full year result in a net loss, like what happened to Semb Corp Marine.
KC, on the other hand, has investment income support that forms 25% of its recurring income, which is something built up over KC's lifetime. This to me, is a reflection of KC's management long-term investment focus and risk appetite, which is one of the main reasons why I have the faith to endure the long winter with KC.
Oh, and the dividend yields for KC are higher, so I am happy to get paid to ride this roller coaster.
The writer owns units of Keppel Corp shares at the time of writing.
References:
Thursday, March 3, 2016
What will I buy with $3000 (Mar 2016)?
Read more about First Stock Series.
Over the past one month, stocks have risen ~5%. If anyone made money out of it, it would have been pure luck. Nobody would have expected Saudi Arabia and the 70% of the oil suppliers to agree to freeze oil output. They could have done this 1.5 years ago, but they didn't.
In Singapore, manufacturing output decreased, which was not surprising as Singapore's labour costs had been growing the past 10 years and factories shift out. Office supply is adding pressure on rentals, which is also expected (we all knew this when these projects started construction 4 years ago), so the market has priced that in. If you look at how each industry contributes to Singapore's GDP, you will know why a manufacturing output drop is deemed to be a sign of a technical recession coming our way. Finance and business services (e.g. consulting) are growing.
For me, as long as the population grows, businesses will always be in business, (of course) subjected to prudent financial management. The growth investor may want to invest in businesses that benefit from higher population densities. Trains breaking down more often doesn't count. Examples of such businesses are food, medical services, waste disposal, high-tech construction, logistics, etc.
I probably will recommend the first-time investor to buy on weakness, i.e. wait for the current wave to subside to a support level before making any purchases. Steer clear of bank and oil stocks if you can't survive a market shock.
1. SPH REIT* $0.95, 5.7% yield. If you buy 3,000 units, you can expect to get $150/year. Pros: Rental from Paragon and Clementi Mall are expected to be stable.
2. AIMS AMP Capital REIT $1.33, 8.5% yield. Pros: Diversed industrial properties (business parks, light industrial buildings, warehouses) on rental with continual asset enhancement activities (i.e. rebuilding/renovating old buildings). Buy 2,200 units, and expect to get $249/year.
Read the financial statements before putting your money on any stocks.
The above is by no means a fail-proof recommendation to buy. Stock prices fluctuate and buyers need to be aware of the risks.
The writer owns stocks marked *.
Over the past one month, stocks have risen ~5%. If anyone made money out of it, it would have been pure luck. Nobody would have expected Saudi Arabia and the 70% of the oil suppliers to agree to freeze oil output. They could have done this 1.5 years ago, but they didn't.
In Singapore, manufacturing output decreased, which was not surprising as Singapore's labour costs had been growing the past 10 years and factories shift out. Office supply is adding pressure on rentals, which is also expected (we all knew this when these projects started construction 4 years ago), so the market has priced that in. If you look at how each industry contributes to Singapore's GDP, you will know why a manufacturing output drop is deemed to be a sign of a technical recession coming our way. Finance and business services (e.g. consulting) are growing.
 |
| Extracted from Statistics Singapore |
I probably will recommend the first-time investor to buy on weakness, i.e. wait for the current wave to subside to a support level before making any purchases. Steer clear of bank and oil stocks if you can't survive a market shock.
1. SPH REIT* $0.95, 5.7% yield. If you buy 3,000 units, you can expect to get $150/year. Pros: Rental from Paragon and Clementi Mall are expected to be stable.
2. AIMS AMP Capital REIT $1.33, 8.5% yield. Pros: Diversed industrial properties (business parks, light industrial buildings, warehouses) on rental with continual asset enhancement activities (i.e. rebuilding/renovating old buildings). Buy 2,200 units, and expect to get $249/year.
Read the financial statements before putting your money on any stocks.
The above is by no means a fail-proof recommendation to buy. Stock prices fluctuate and buyers need to be aware of the risks.
The writer owns stocks marked *.
Wednesday, February 24, 2016
Stock Review: DBS, OCBC, UOB
I wrote a review one year ago about DBS, OCBC and UOB. The three banks have since published their full year results and I am reviewing them again.
Over the past 10 months, banks, not just in Singapore, had been battered really badly. I had been buying all three bank stocks, but what should a new buyer be looking out for?
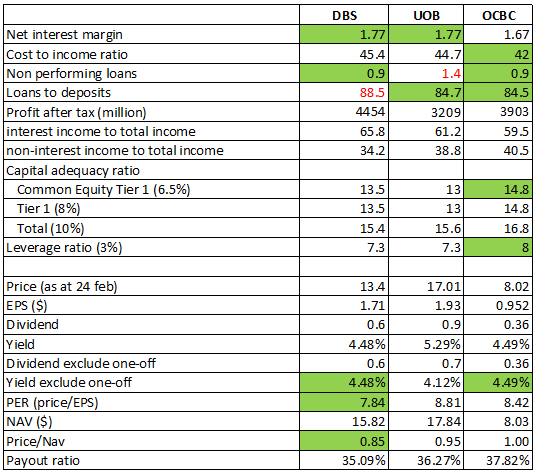
1. Debt to Deposit ratio
The loan to deposit ratio is used to calculate a bank's ability to cover withdrawals made by its customers. In Singapore, the Singapore Deposit Insurance Act insures deposits by individuals up to $50,000. This is a safeguard against bank customers, such as you and I, to withdraw our money en masse when the bank shows signs of weakness. For e.g. when you see a headline such as HSBC made a net loss for their full year, as a customer, you may feel worried that your deposits may disappear if the bank goes bankrupt, and hence want to withdraw your money. If many people do that, the deposits outflow will create cash flows problems for the bank, which worsens the bank's financial woes.
A ratio of 1 (100%) means that for every $1 loan given, it is supported with $1 deposit from another customer.
Compared with the US banks, the SG banks' debt to deposit ratio is high (84-89%). Read this recent article about the US banks. As the US banks prepare for the interest rate hike, JP Morgan, the most risk-adversed, maintained a debt to deposit ratio of 60%. There is no magic number, just a risk appetite measurement.
2. Cost to Income ratio
This ratio calculates a bank's expenses as a multiple of its income earning ability -- the lower, the better. Compared with a year ago, all three banks' cost to income ratios had increased.
Verdict
OCBC appears to be the best positioned out of the three. This confidence is also reflected in its market price where Price/NAV is 1 (i.e. fully valued). Although DBS' Price/NAV is 0.85, it may not be undervalued, as the market had priced in its risks towards non-performing loans in the commodities sector which DBS has the highest exposure to.
Among the three financial reports, the DBS CEO was particularly upbeat about the economy, delivering lots of confidence in the business outlook for even badly battered commodities sector. In fact, they presented the "worst case scenario" where all the commodities debt go bad and they would still be in good shape. In my opinion, based on the sectors with higher absolute amount of non-performing loans, the companies that we need to be wary about are in industries such as manufacturing, transport, logistics, communications. If we have holdings in industrial REITs, where these companies typically operate in, we would need to keep our eyes on the "account receivable" component of the balance sheet to ensure that their tenants are on-time in their rental payments.
Housing loans form a substantial fraction of non-performing loans for UOB. This could be a sign that prices of high-end condominiums will continue to fall because UOB targets this sector of home loans. Consequently, we should also take note of the property developers that are still holding on to vacant units of similar high-end condominium developments. Leasehold units should expect a worse fall based on historical trends.
Buy based on yield, if you can afford to hold for more than five years, the 4.5% yields are very good value for money because in good times, yields hover around 2-3%. If you just have your last $5,000 or less, don't bet on these stocks to make a quick rebound anytime soon.
The writer owns units of DBS, OCBC and UOB shares at the time of writing.
References:
Over the past 10 months, banks, not just in Singapore, had been battered really badly. I had been buying all three bank stocks, but what should a new buyer be looking out for?
| Bank | Peak | Low | % change |
| DBS | $21.50 | $13.01 | -39.5% |
| OCBC | $10.92 | $7.41 | -32.1% |
| UOB | $25.05 | $17.01 | -32.1% |
1. Debt to Deposit ratio
The loan to deposit ratio is used to calculate a bank's ability to cover withdrawals made by its customers. In Singapore, the Singapore Deposit Insurance Act insures deposits by individuals up to $50,000. This is a safeguard against bank customers, such as you and I, to withdraw our money en masse when the bank shows signs of weakness. For e.g. when you see a headline such as HSBC made a net loss for their full year, as a customer, you may feel worried that your deposits may disappear if the bank goes bankrupt, and hence want to withdraw your money. If many people do that, the deposits outflow will create cash flows problems for the bank, which worsens the bank's financial woes.
A ratio of 1 (100%) means that for every $1 loan given, it is supported with $1 deposit from another customer.
Compared with the US banks, the SG banks' debt to deposit ratio is high (84-89%). Read this recent article about the US banks. As the US banks prepare for the interest rate hike, JP Morgan, the most risk-adversed, maintained a debt to deposit ratio of 60%. There is no magic number, just a risk appetite measurement.
2. Cost to Income ratio
This ratio calculates a bank's expenses as a multiple of its income earning ability -- the lower, the better. Compared with a year ago, all three banks' cost to income ratios had increased.
 |
| Extracted from individual financial reports. Distribution of income sources and loan currencies. |
 |
| Extracted from individual financial reports. Key financial ratios. |
OCBC appears to be the best positioned out of the three. This confidence is also reflected in its market price where Price/NAV is 1 (i.e. fully valued). Although DBS' Price/NAV is 0.85, it may not be undervalued, as the market had priced in its risks towards non-performing loans in the commodities sector which DBS has the highest exposure to.
Among the three financial reports, the DBS CEO was particularly upbeat about the economy, delivering lots of confidence in the business outlook for even badly battered commodities sector. In fact, they presented the "worst case scenario" where all the commodities debt go bad and they would still be in good shape. In my opinion, based on the sectors with higher absolute amount of non-performing loans, the companies that we need to be wary about are in industries such as manufacturing, transport, logistics, communications. If we have holdings in industrial REITs, where these companies typically operate in, we would need to keep our eyes on the "account receivable" component of the balance sheet to ensure that their tenants are on-time in their rental payments.
Housing loans form a substantial fraction of non-performing loans for UOB. This could be a sign that prices of high-end condominiums will continue to fall because UOB targets this sector of home loans. Consequently, we should also take note of the property developers that are still holding on to vacant units of similar high-end condominium developments. Leasehold units should expect a worse fall based on historical trends.
Buy based on yield, if you can afford to hold for more than five years, the 4.5% yields are very good value for money because in good times, yields hover around 2-3%. If you just have your last $5,000 or less, don't bet on these stocks to make a quick rebound anytime soon.
The writer owns units of DBS, OCBC and UOB shares at the time of writing.
References:
Wednesday, February 3, 2016
What will I buy with $3000 (Feb 2016)?
Read more about First Stock Series.
Across the world, stocks continued to fall and we had reached a point where all the "psychological support levels" were broken. After throwing a few months' worth of budgeted investment money into the market, and suffering immediate paper losses, I also sat out for a large part of it to wait for the next level of new lows. Wherever the market would go in Feb would be anyone's guess. However, traditionally, before the Singapore Budget announcements in Feb, there would be a stock rally of some-sort.
1. SPH REIT* $0.91, 6% yield. If you buy 3,000 units, you can expect to get $165/year. Pros: Rental from Paragon and Clementi Mall are expected to be stable.
2. Singapore Technologies (ST) Engineering Ltd* $2.70, 6% yield. If you buy 1,000 units, you can expect to get $160/year. Pros: Cost-conscious management, ever-increasing defense budget that contributes to increasing revenue.
I am conscious that the overall sentiment is rather weary, and for a first-timer to decide to take the first plunge in a time like this is going to be hard, so I am recommending just two companies which I think will weather any shocks in Feb, if any more were to come our way.
There you go! Google search, read the financial statements, before putting your money on any stocks.
The above is by no means a fail-proof recommendation to buy. Stock prices fluctuate and buyers need to be aware of the risks.
The writer owns stocks marked *.
Across the world, stocks continued to fall and we had reached a point where all the "psychological support levels" were broken. After throwing a few months' worth of budgeted investment money into the market, and suffering immediate paper losses, I also sat out for a large part of it to wait for the next level of new lows. Wherever the market would go in Feb would be anyone's guess. However, traditionally, before the Singapore Budget announcements in Feb, there would be a stock rally of some-sort.
1. SPH REIT* $0.91, 6% yield. If you buy 3,000 units, you can expect to get $165/year. Pros: Rental from Paragon and Clementi Mall are expected to be stable.
2. Singapore Technologies (ST) Engineering Ltd* $2.70, 6% yield. If you buy 1,000 units, you can expect to get $160/year. Pros: Cost-conscious management, ever-increasing defense budget that contributes to increasing revenue.
I am conscious that the overall sentiment is rather weary, and for a first-timer to decide to take the first plunge in a time like this is going to be hard, so I am recommending just two companies which I think will weather any shocks in Feb, if any more were to come our way.
There you go! Google search, read the financial statements, before putting your money on any stocks.
The above is by no means a fail-proof recommendation to buy. Stock prices fluctuate and buyers need to be aware of the risks.
The writer owns stocks marked *.
Subscribe to:
Posts (Atom)