Friday, September 30, 2016

SGXCafe - a tool to track your portfolio

I don't receive anything out of this recommendation. I want to commend the creator of SGXCafe for the website he developed. If you are serious about investing, you will most probably be like me who religiously track every buy/sell transaction. The reason is to know what the breakeven price is if we need to cut loss or to calculate the total return on our portfolio. This is a very tedious process. SGXCafe simplifies all that and saves at least 1 man hour a month of my time checking the dividend dates, updating the dividend amounts to revise my portfolio returns, etc. I spend 1 man hour partly also because I have many shares to read and update.

Here's how it will look like: https://www.sgxcafe.com/user/profile?username=jarwey

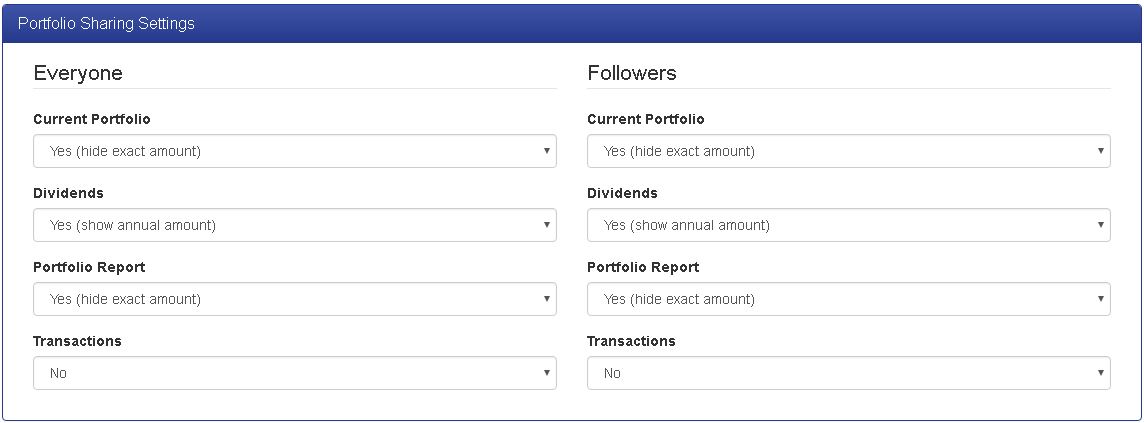
I chose not to show the actual amount, but anybody who is smart enough can guess by looking at the total dividend and work backwards.
SGXCafe Profile Sharing Settings
Benefit 1: Calculates total return per share (past dividends collected + capital gain)

Benefit 2: Calculates total return for your portfolio. You can create different portfolios to calculate this return differently if you are managing different accounts for your family members.

Benefit 3: Easy to share the portfolio to friends who ask you what you have bought. Particularly useful when you have so many shares that you can't remember every single one within 5 seconds.

Frill: A game that you can play to practise your skill at evaluating stocks. To be honest, this is probably not suitable for newbies because it doesn't teach you how to evaluate. It shows a bunch of financial ratios and you decide whether to buy or not. As the game removed the company name, the business is unknown to you, but you can see how well/badly the company performed compared with similar businesses (in the same industry). Here's how the scoring is done:


Although the creator asked for feedback to share how we (the players who had played the game) evaluate the numbers, I find it hard to explain what goes through my mind. One thing I know for sure is I always avoid companies making losses. Out of all the loss-making companies I chose to ignore, I only recall 1 or 2 companies that outperformed, which is probably the most a 5%. I am ok to forego that 5% companies for now, but I haven't given up trying to identify what indicators will point to the outperform possibility.

Monday, September 5, 2016

What will I buy with $3000 (Sep 2016)?

I didn't post what I will buy with $3000 in Jul and Aug 2016 because I wouldn't have bought anything. My last purchase was $3000 worth of SPH REIT in Jun. I felt that it was worthwhile to adopt a wait-and-see attitude because traditionally, the second half of the year usually performs worse than the first half of the year.

Without spending $3000 x 2 for the 2 months, it means I have $6000 more in my opportunity fund (aka warchest). I had also been trying to digest the statistics, in particular, unemployment statistics. The reason is there had been many reports of company retrenchments worldwide in sectors that are facing lower demand and higher automation. Unemployment rates inched up a little. For the quarter ending Jun, it's 3.1% for Singaporeans. Overall, including foreigners, the rate is 2.1%.

The next number I was looking at was job vacancy rate, which means jobs that have not been filled. For example, you want to hire a waitress, you will contribute to this job vacancy number that is measured every quarter. This is no data for the quarter ending Jun, but the job vacancy to unemployed person ratio is 1.03 for Mar, which means there are more job vacancies than unemployed persons. This rate is quite similar to the rate in 2012, but circumstances are different. In 2012, the property fever had not been tamed. In fact, the cooling measures had the reverse effect of buyers rushing to buy properties for fear that there will be more cooling measures that will prohibit them from buying in future. STI in 2012 was around 3000 points, versus 2800 now, for the same timeframe of Aug-Sep.

What will I buy in Sep? More bank shares if it heads back into the low range. If not, I will just add the $3000 into my warchest and continue to hug my warchest tight. Read my earlier bank stock review which shows the low range prices.

The writer owns units in SPH REIT, DBS, OCBC and UOB.

Friday, August 26, 2016

SGX Stockfacts Screener

There are 728 companies listed on the SGX. For the first-timer, or relatively new investor who have had fewer than five transactions, you are probably still conforming with social proofs -- a bias that believes that if everybody is doing something, it can't be too wrong.

As a non-conformist, and I say that because I will probably be the out-lyer in most social experiments, I am conscious of all these cognitive biases and human natures, hence I consciously act on raw, hard, facts that will stare at my face while I concurrently tear away any emotions.

Here's my simple criteria to selecting stocks, backed by sound financial fundamentals.

  1. Low Debt/Equity (D/E) ratio You can never be any safer than following this ratio. A company with little or no debt means that the company has superb money management. They watch their top and bottom very tightly. This is very suitable for new investors because of the loss/risk aversion bias.
  2. Minimally 3.5% yield Bank of China pays 3.55% p.a. on balances up to $60k if you credit your salary, spend $500/month on credit card, and pay 3 bills. It's safe to have dividends higher than the savings interest rate. A metric to look at for over-valued companies are extremely low yields, such as tech companies that cost a bomb before they even start to make enough money to pay you dividends higher than the savings account interest of 0.05%.
  3. Price/Earning ratio < 13 which is an STI average This is also an arbitrary anchor to make you see feel safer that you are buying a stock that is below the average, which has a lower chance to be over-valued compared with another company that is above the average.
  4. At least $800M market capitalization This is an arbitrary number I took from someone else's study (I can't remember) that companies in the 70-th percentile in terms of market capitalisation have the best performance. The companies are big enough to secure funds/loans for expansion, likely have established corporate governance structures, but are also small enough to grow and transform to seize opportunities, usually have one boss to call the shots. The very very large caps (e.g. >$10B) with very established businesses will not be able to adjust as quickly because of multiple layers of management to manuverve and many stakeholders with vested interests. They tend to be over-valued as well because the market pays a premium for their track record and reputation.
With these simple criteria, I present you a screen shot of only 20 companies that can satisfy my selection criteria from SGX Stockfacts Screener...

Here's how you select the criteria, if you don't know how.

Here's the shortlisted 20 companies.

This is the easy part. Now, start reading up on each company to find a business that resonates with your beliefs. You are one step nearer than 728 companies staring at you.

The writer owns shares in SIA Engineering, Keppel Corporation and Keppel REIT.

[Updated on 27/8/2016: You can also check the market statistics that SGX compiles every month to show which are the performing sectors. In this year, until Jul, Consumer Goods, Telco and REITS were the top 3 performers. How I use this data is to look for those sectors that are negative and study the companies in those sectors to look for under-valued stocks. Those that are positive, I will just verify with my stock selections to see if I had performed better than the average. For example, telco 12.84%: my singtel share bought at $3.60 last year is $4.20 now, so it's +16.67%, so I had performed better than the average.

Annual Sectorial Performance of Singapore Securities
]

Sunday, August 21, 2016

Stock Review: Hyflux

I haven't recommended any first-stock this month because I didn't come across any to recommend.

Today I will review Hyflux -- the darling who created Singapore's NEWater. CEO Olivia Lum was a household name when she quitted school to start her company to make this first-of-a-kind Singapore-made water filtration technology because I own 30 units of 6% Cumulative Preference Shares (CPS) which I bought via an IPO in 2011. The structure was such that you get paid $6/year for every $100 unit held for 7 years. Upon maturity, Hyflux either redeems your capital or extends the tenure by a duration to be determined but at a 8% rate. The main reason why I bought it was because it was like a bond, and we have limited bond choices as retail investors.

Last week, this said CPS was trading below par value, or $100. The lowest was $93. Over the past 6 years holding this CPS, the price had been always at least $100. That pompted me to dig little deeper into its financial report.

The company is debt-laden. Debt/Equity (D/E) ratio is 80 as at Jun 2016. The lower the better. There are many other companies who fare much worse, so don't be too alarmed. There are other companies with similar preference shares holding much much much more debt (about 4 times more than Hyflux), for e.g. Oxley holdings (D/E = 348). Aspial's DE = 208. Basically I had divested all my shares in any company whose D/E ratio is above 50 because the economy is undergoing a lot of change and companies with high debt will likely have difficulties changing because they may not have the money to make the moves they want.

Top 10 D/E companies extracted from SGX Stockfacts

Anyway, back to Hyflux. After going through the financial report, the line item that is burning their cash is something I don't really understand, this term called "service concession arrangement". After doing a Google search, I seem to understand it as a maintenance agreement to manage and operate the water/energy plant after Hyflux constructs it. Hyflux owns the rights to manage and operate and these rights can be sold to other operators. However, as the filtration technology is proprietary to Hyflux, I am not sure whether there are patent or rights income because I don't see it anywhere in the financial report.

The other thing I was trying to identify was the profit margin to operate the plants. In 1H2015, profit margin (before tax) was 22%. in 1H2016, profit margin (before tax) was 2%. I seriously hope that I am misinterpreting the report. What happened over 1 year? 2 projects started, so higher revenue had been recorded, however, expenses are also very high as these are construction costs (~S$300M). The 2 projects are: TuasOne waste-to-energy (“WTE”) project (to be completed in 2019, client NEA) and Qurayyat Independent Water Project (“IWP”) in the Sultanate of Oman (to be completed in 2017, client Oman gov). This S$300M is likely the "service concession arrangement" line item on the cash flow sheet. In terms of reporting, I would have preferred the project expenses and loans to be tracked separately to show that their cash flow issues are purely because of the projects.

My conclusion is that Hyflux' negative cash flow issues are due to project construction costs. However, this is not conclusive as the company chooses not to separate the development and maintenance business. I still have faith to hold on to my CPS. If I were the Hyflux CEO, I will probably want to report my revenue, expense, debt, profit by the business nature. In terms of construction projects, I will also require my clients to pay me more upfront to manage my cash flow better. I probably prefer to buy the CPS that guarantees the 6% payout than to buy Hyflux equity ($0.51, 1.2 cents dividend or 2.3% yield) whose dividend is currently heavily penalised because of negative cash flow.

The writer owns Hyflux CPS 6% at the time of writing.

Tuesday, August 2, 2016

Stock Review: Sheng Siong Group

Sheng Siong is a household supermarket name. I had been avoiding it because I felt that their ethics could be improved and by that, I just felt that they were exploiting cheap labour, exploiting foreigners, selling low quality food, taking advantage of hawkers because they bidded for a hawker centre and turned it into a more expensive food court, etc.

Then I realised that all this while, Sheng Siong's share price had been rising non-stop. Do I hop on in support to earn some pocket money or do I hang on to my belief that because of their way they operate their business, they will get some "retribution" in time to come.

They have hit all the right notes. No debt. Dividend payout is almost 90%. Positive and growing cash flow. Marketing efforts are superb, analyst coverage is perfect (100% issue buy calls), every financial report, they report a bit about what they want to do and how they are achieving it. They expand their stores every year. They are even starting one in China, Kunming.

At $1.02 and 3.6 cents dividend, it translates to a yield of 3.5% which is decent.

It's tempting, but then I ask myself again whether they are exploilting cheap labour ($2.88M worth of Government Grant under Wage and Special Employment Credit Schemes, as reported in the Q2 2016 financial report). I asked myself whether it's their fault that they turned the hawker centre into a food court or is it the government's? While it could be the government's fault for publishing the tender, Sheng Siong had the choice to run it as a hawker centre or a food court and it chose to charge it as a food court.

Profit margins are growing. 10% is high. They could have paid these employees higher salaries. They could have sold better quality food to improve the well being and health of the lower income families who patronise their supermarkets. As a shareholder, I will like it, but I then ask myself whether it's morally right to take advantage of the lower income group that Sheng Siong targets and I can't bear to want to have a part in it.

It is also this very same moral principle that I also don't buy SMRT's shares. I don't own any Sheng Siong shares. I don't foresee myself buying it although it looks attractive. However, if you don't have this same moral dilemma that I have, just go forth and buy.

Tuesday, July 12, 2016

A study on my portfolio allocation

Whenever large price swings happen, I always recall what the feng shui masters say about the Year of the Fire Monkey -- that there will be a bull run for the financial markets until Apr 2017 with many wild swings in between. Anybody who observes the trend will know that April is always the best month for any market, so that was a no brainer prediction. The reason given was that Fire favours financial markets and fans a bull run. When we look further into the Fire element, 2017 will be the Fire Rooster, and if the fire symbolises a bull run in the financial markets, then 15 Feb 2018 could be the end date. However, history has also shown that nobody can predict a market crash, so we just need to be rational about investing, while keeping in mind that crashes do happen.

When I buy stocks, I usually go by what I perceive as intuitive decision-making. Over the past few months, I had been thinking about putting structure and logic into my intuition so I started with a portfolio allocation study of my own portfolio formed by, supposedly, my intuition. Perhaps it is something I subconsciously know about but have not written it out before.

Before I buy, I usually have to answer Yes to a few basic questions:

  1. Is the business income model sustainable?
  2. Is the growth driven by legitimate economic demand?
  3. Is the yield >= 5%?

Assuming Yes to #1 and #2, if the yield is <5%, I will check what the historical yield (10-20 years) is. If the current yield is higher than the historical yield, then it's ok to buy.

The first exercise was to calculate the yield distribution. I currently have a 5% p.a. return. Market value vs. capital is -15% in the current down market. "3-4%" means more than 3 and less than or equal to 4.
My portfolio allocation by yield (based on ~S$200k capital)

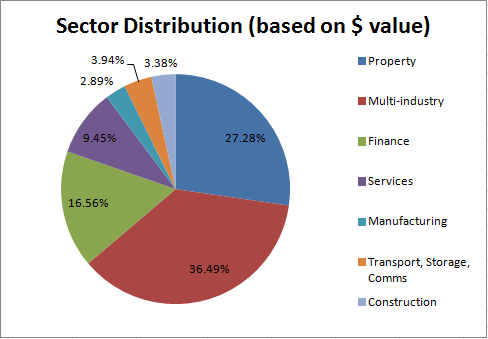
The second exercise was to study the industry/sector the companies are in. The categories follow the SGX sector classification. I favour conglomerates with multiple businesses and property landlords. Having multiple businesses allows the company to more efficiently operate, especially when the businesses are related from a supply-chain perspective. These companies also tend to have passive income (expenses are very low relative to the income earned), which I like a lot.


The third exercise was to study my risk appetite. I usually don't like debt-ridden companies. Ratios I always look at are :

  • Debt/Equity ratio (lower the better)
  • Enterprise Value/EBITDA (lower the better)
  • Receivables (quarter to quarter comparison) this will usually signal whether their customers have problems paying and it's useless (bad debt) if the customers cannot pay up.

Portfolio allocation only makes sense when your capital is at least $50,000. However, it is important to also know what you are building so that you will slowly see your portfolio become the portfolio you have imagined it to be. While I said that I bought based on intuition, I probably took the easy way out to explain how I selected the shares I bought.

Thursday, June 16, 2016

Stock Review: Yoma Strategic Holdings

Yoma's founder is an enterprising man, Mr Serge Pun (63). He is a Myanmar national who started a company in Hong Kong in real estate development, progressed into real estate investment. His business spanned Bangkok, Shenzhen, Kuala Lumpur, Chengdu, and then finally Myanmar.

Yoma's business is primarily about real estate development business in Myanmar, managed by Serge Pun's two sons, CEO Melvyn Pun (38) and Cyrus Pun (36). The business also diverged into automotive (tractors), F&B (KFC) and tourism (balloons), with real estate still forming majority of the business.

There are a few figures in the financial report that I will dig into.

Profit Margin
What I could not find in the financial report was the expense per sector to find which sector was the most profitable. Instead, revenue was the only number that was categorised. As a result, I am forced to calculate the profit margin for the business as a whole -- 39% in 2016 and 35% in 2015 which are extremely high margins for a property developer.

Revenue categories extracted from financial report
Balance Sheet
Net cash is positive, however assets are largely contributed by development properties and land development rights. Asset value increased $100M to ~$950M as at 31 Mar 2016, contributed by increase in trade receivables, higher values of development property and land development rights. I didn't like it that the report didn't explain whether the higher values were due to higher valuations or increase in stock. There was a brief description about valuation gains for their investment properties.

Revenue Driver
Revenue driver appears to be driven by debt, which does not look sustainable to me -- debt steadily and proportionally increasing with revenue.

Star City
ALL the properties are in this little carved out "world" called Star City or Thanlyin. On the map, it appears to be a plot of land separated from the Yangon city centre by a river. It is marketed as a new township for the upper class.

extracted from Google Maps
What puzzles me is Star City is surrounded by farm land (at least to me it seems like it on the map). Yet the residential buildings are 8 to 12 storeys high, which will require lifts. I consider it too expensive a commodity to maintain. I would have believed a little bit more in the township and planning story had it been a combination of landed houses and 4 storey walk-up apartments spanning a wider area to help people move into homes they can afford.

Myanmar is also a relatively poor country with GDP per capita of US$1,183 in 2013. For comparison sake, Singapore's GDP per capita was US$54,648 in 2013. Indonesia, US$3,475. Vietnam, US$1,867.

Conclusion
While Myanmar is just beginning their path to democracy, it will take a lot of hard work and cleaning up (of corruption, crime, etc.) to be able to improve its citizens' standard of living. Building high-rise buildings with international schools in a ring-fenced, secured, Star City will not help the average citizen afford a better education or house. Unfortunately, it reminds me a lot about Malaysia's Iskandar township story. I wouldn't place my money on Yoma Strategic at its current price of 56 cents. Dividend was 0.25 cents or 0.4% yield. However, it could become an overnight darling like Genting Singapore if there are many speculators in Thanlyin, but the bubble will definitely burst for this one because high prices are not supported by fundamental wage growth and affordability in Myanmar.

References:

  1. Full Year 2016 Financial Report
  2. FY2016 Presentation Slides