Singtel I bought more shares when prices hit $3.60 (4.86% based on 17.5 cents) after it went XD (post dividend). Historically, Singtel share prices cycle up and down within a year so I see this as an opportunity to buy. I would have preferred to have a higher yield though.
Stock shopping is beginning to feel more expensive, which is a sign that the market is picking up. In my view, as long as we avoid the medical and food stocks which tend to be over-priced, it's still possible to find some fair price items. For e.g., Singtel, AIMS AMP, QAF, SIA Engineering, ST Engineering. For those with weak hearts, avoid the bank stocks that have risen by 50% from their troughs in Feb 2016, 22 months ago, because you might be in for another roller coaster ride.
Outlook seems to be more positive, which may not be a good thing. Confidence breeds complacency.
Wednesday, December 27, 2017
Friday, December 8, 2017
How much have I earned and lost in 2017?
How much have I earned and lost in 2016?
My objective for 2017 was to maintain my existing portfolio and receive $10,000, and achieve a stock to cash (exclude emergency funds) allocation ratio of 50:50. I met my target. It is also a milestone for me to have finally reached $1,000/month of passive income. It has been 14 years since I dreamt of hitting this target. It had been a combination of work hard to increase my earned income, to learn how to pick stocks, and to cultivate patience and will-power.
Income was $11,800 (this is based on received, will be $12,800 if based on ex-date), which was largely due to increase in portfolio and better bank interest rates for interest income from Bank of China 2.5%, UOB One 2.43%, Hong Leong Finance 1.7%, CIMB Fastsaver 1%, Singapore Savings Bonds 1.1%. I picked up $29 worth of coins (about 100 coins, of which 40 coins are 5 cent coins, which is still $2). Every coin adds up.
Average dividend yield is 4.56% (based on ex-date). After some rebalancing this year and using retirement calculators, I decided that my objective for 2018 is to increase my average yield by 0.5%, and then maybe another 0.5%/year for another 2 years, to 6%, but I will reassess this at the end of 2018. This will need to be supported by increasing REITs to 50% of my portfolio. Currently, the ratio is about 23%, I will implement this by rebalancing and capital injection at the right prices over 3 years, from 23% -> 33% -> 43% -> 50%.
I also started investing in Vanguard ETFs through Autowealth, adopting a dollar cost averaging approach, but I select which day of the month to deposit my money to buy, hoping to catch low points in a month. I started with $5,000 in Aug 2017, and contribute $400/month. It is currently returning an insane annualised yield of 15%, which I don't believe is sustainable, hence I am taking it slow and steady.
Unrealised profits which is nice to see but cannot eat:
Autowealth = S$260
Singapore Stocks = $20,000
Although we are not at the end of the year yet, I don't foresee much variation over the next few weeks. I will update again if there is a sudden market crash or something.
Objective for 2018: Increase REITs by 10%, increase portfolio yield by 0.5%, increase income to $14,000.
Lifetime accumulated dividends and interest, net of losses = $49,000
Portfolio income "methodology": Assuming that I continuously invest $36,000/year or $3,000/month,
In 3 years, accumulated dividends and interest = $100,000, $1,600/month
In 7 years, accumulated dividends and interest = $200,000, $2,200/month
In 10 years, accumulated dividends and interest = $300,000, $2,700/month
Compounding is awesome. Every coin adds up.
My objective for 2017 was to maintain my existing portfolio and receive $10,000, and achieve a stock to cash (exclude emergency funds) allocation ratio of 50:50. I met my target. It is also a milestone for me to have finally reached $1,000/month of passive income. It has been 14 years since I dreamt of hitting this target. It had been a combination of work hard to increase my earned income, to learn how to pick stocks, and to cultivate patience and will-power.
Income was $11,800 (this is based on received, will be $12,800 if based on ex-date), which was largely due to increase in portfolio and better bank interest rates for interest income from Bank of China 2.5%, UOB One 2.43%, Hong Leong Finance 1.7%, CIMB Fastsaver 1%, Singapore Savings Bonds 1.1%. I picked up $29 worth of coins (about 100 coins, of which 40 coins are 5 cent coins, which is still $2). Every coin adds up.
Average dividend yield is 4.56% (based on ex-date). After some rebalancing this year and using retirement calculators, I decided that my objective for 2018 is to increase my average yield by 0.5%, and then maybe another 0.5%/year for another 2 years, to 6%, but I will reassess this at the end of 2018. This will need to be supported by increasing REITs to 50% of my portfolio. Currently, the ratio is about 23%, I will implement this by rebalancing and capital injection at the right prices over 3 years, from 23% -> 33% -> 43% -> 50%.
I also started investing in Vanguard ETFs through Autowealth, adopting a dollar cost averaging approach, but I select which day of the month to deposit my money to buy, hoping to catch low points in a month. I started with $5,000 in Aug 2017, and contribute $400/month. It is currently returning an insane annualised yield of 15%, which I don't believe is sustainable, hence I am taking it slow and steady.
Unrealised profits which is nice to see but cannot eat:
Autowealth = S$260
Singapore Stocks = $20,000
Although we are not at the end of the year yet, I don't foresee much variation over the next few weeks. I will update again if there is a sudden market crash or something.
Objective for 2018: Increase REITs by 10%, increase portfolio yield by 0.5%, increase income to $14,000.
 |
| Chart of humble beginnings |
Portfolio income "methodology": Assuming that I continuously invest $36,000/year or $3,000/month,
In 3 years, accumulated dividends and interest = $100,000, $1,600/month
In 7 years, accumulated dividends and interest = $200,000, $2,200/month
In 10 years, accumulated dividends and interest = $300,000, $2,700/month
Compounding is awesome. Every coin adds up.
Thursday, December 7, 2017
What did I buy in Nov 17?
QAF I bought more shares when prices hit $1.10. As there was price weakness after the oversupply of pork in Australia, I decided to spread purchases over a few months to get a better spread. If prices were to remain at this level, I may add more.
Other shares that I had been watching are:
I had no luck at the RE&S IPO.
No bargains in the market, so I will continue to save up and wait.
Other shares that I had been watching are:
- SIA Engineering
- Comfort Delgro
- Singapore Press Holdings
- ST Engineering
I had no luck at the RE&S IPO.
No bargains in the market, so I will continue to save up and wait.
Wednesday, November 8, 2017
Stock Review: M1
Earlier on when M1's price was hovering around $2, I briefly calculated a price tag of $1.75 before I will do a more detailed review of M1's financial report. I just assumed no dividend at year end, hence whole year dividend of 11 cents, -20% discount to factor in -20% YoY decline, divide by 5% yield and arrived at 11 x 0.8 / 0.05 = $1.76.
Taking its debt and committed CAPEX into consideration, I am sitting out and will probably review again when the price hits $1.39.
On 11 Aug 17, the lowest price was $1.705. Prices have been hovering around $1.78, but I think it's time I write a review. High tide floats all boats and the market is at a high tide now so I am ignoring market prices.
In M1's 3Q2017 report, the concluding sentence was "Based on current outlook and barring unforeseen circumstances, we expect a decline in net profit after tax
for the year 2017."
"Net profit after tax declined 4.8% year-on-year for third quarter and 13.9% year-on-year for 9 months
ended 30 September, 2017. This is in line with our previous outlook statement." -- From here, I think it's safe to assume that it will decline 20% YoY.
9M2017 EPS = 10.9 cents. assuming straight line decline, annual EPS should be 14.5 cents.
Assuming a payout ratio of 90%, which is the lower end of M1's historical payout ratio, dividend for 2017 = 13 cents.
Assuming 2 more years of consecutive 20% YoY decline,
2018 EPS 14.5 x 0.8 = 11.6 cents
2019 EPS 11.6 x 0.8 = 9.28 cents
Apply payout ratio of 90%, 9.28 x 0.9 = 8.352 cent
5% yield = 8.352 / 0.05 = $1.67
6% yield = 8.352 / 0.06 = $1.39
This is the extent of the margin of safety you can get at lower prices.
Two things were neatly hidden in plain sight which a casual reader will probably miss out.
1. Debt appeared to be downplayed. "Gearing ratio" is a technical term which casual readers will miss. It is calculated by dividing Total Debt by Total Equity. Total Debt is how much the company has borrowed. Total Equity is how much capital and retained earning over the years. When retained earnings is high, it shows that the company has been successful in accumulating wealth. If the company always pays out 100% of earnings as dividends, then $0 goes into Equity. Imagine you have $10,000 in your savings and I lend you $60,000 as unsecured lending (not backed by anything like your branded handbag or gold ring), your gearing ratio is 6 times, and I run a very high risk of not getting my money back because you only have $10,000.
Interest coverage ratio shows the ability of the company to pay interest expenses with earnings - the higher the better - they were in a better position in 2016 because earnings were higher. Imagine you have a fixed interest expense, and your salary is decreased 20% YoY, then you will find it harder to repay. Usually you need to pay the interest to keep the loan active so that your bank will not force you to sell your assets to raise money.
| 9M2017 Page 20 of 22 Gearing and Interest Cover |
However, this will probably not concern you if you are a shareholder of Starhub because Starhub's gearing ratio is much higher at 6 times. Just for comparison, I had calculated Singtel's gearing ratio too. Just as an illustration, REITs have a gearing ratio of around 30% to max 45%, so you read it in REITs presentation slides as 0.3x or 0.45x.
 |
| Accurate as at date of data extraction on 8/11/17 |
2. There is also a CAPEX item - spectrum rights - that will likely be recorded in Q4 and beyond. The report did not mention how they will fund the purchase, be it cash or loan. When reconciled with the cash flow statement, nothing has been paid yet.
 | ||
9M2017 Page 19 of 22 - CAPEX and Commitments
|

Monday, October 30, 2017
Am I a High Risk Taker?
Risk assessment questions are often biased. Take the below question from Autowealth as an example. I have nothing against them by the way. I consented to be categorised as a high risk taker.
From my observation, when prices drop by 5%, most people will not buy more, neither will they sell parts or everything. When prices drop by 10%, most will not buy more, instead, some might sell parts or everything. When prices drop by 20%, most will do nothing. When prices increase by 5%, most people will do nothing. When prices increase by 10%, most will sell, especially if prices had been depressed for some time. When prices increase by 20%, more will buy and not sell anything.
I understand that markets are at times volatile. If my investment portfolio loses 10% of its value, I would:
If I choose Buy more, my risk appetite is assessed to be higher. In most cases, buying more is always a representation of someone who takes high risks. In order of risk appetite, a low risk taker might sell everything.
However, there are two aspects to this. In reality, do these people really buy more or they just choose buy more as a textbook answer? Do they sell everything or hope for prices to recover?
The typical question is about a down trend scenario. Let us now think about an up trend scenario with the same scenario options. My portfolio has increased by 10%, if I buy more, am I a high risk taker?
From my observation, when prices drop by 5%, most people will not buy more, neither will they sell parts or everything. When prices drop by 10%, most will not buy more, instead, some might sell parts or everything. When prices drop by 20%, most will do nothing. When prices increase by 5%, most people will do nothing. When prices increase by 10%, most will sell, especially if prices had been depressed for some time. When prices increase by 20%, more will buy and not sell anything.
Many surveys and friends have classified me as a high risk taker. In theory and in practice, that is what I do:
Down trend of a stock - I buy more
Up trend of a stock - I do nothing most of the time. Sometimes I sell 25% of my stock's volume to rebalance if prices have risen to a price that I feel it's too high.
For illustration, between Aug 2015 to Jul 2016, I spent at least 100k buying stocks in a year. I felt poorer and poorer every month because prices continued to fall or remained low. I still remember spending 30k in one particular month. For comparison, I only spent about 20k this year. Everyday I wished that I had more money to buy. I asked my broker to increase my buy quota to 40k because I couldn't submit orders to buy queues. I allocated different budget pots for different price drawdown %, so I was at 70-30 stock to cash allocation when the market was just about -20%. When stock prices started rising, I was relieved because I could finally start saving up again, which shows that I am not that high a risk taker? I see myself taking calculated risks, i.e. I know that I have factored in sufficient margin of safety. I know I had done my best evaluation based on all the known information available when I made the decision. My priority is also income investing because that is a double safety net for me -- a margin from income and a margin from capital gain.
I usually hover around 50-50 stock to cash to feel safe. My financial advisor advises 80-20 investment to cash, investment including ETFs, unit trusts and endowment funds. She said I am taking on more risk by keeping 50% cash. Obviously, we don't have the same definition of risk. Similarly, everybody's definition is slightly different. Hence to really assess the person appetite for risk, maybe that one question is probably a good proxy after all, even if it's just a textbook exercise.
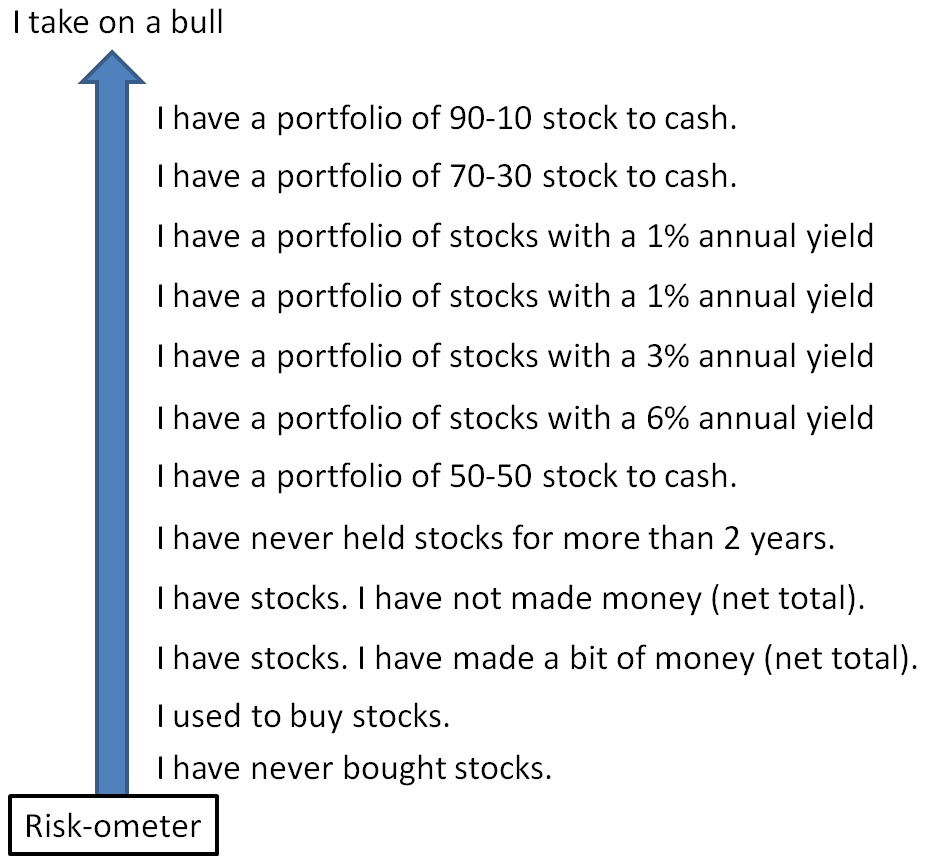 |
| My risk-ometer |
Friday, October 27, 2017
What did I buy in Oct 17?
SIA Engineering (covered in previous post) I didn't add further as the price stablised at $3.20.
Cache Logistics 18 for100 Rights Issue. I also applied for excess rights with UOB (don't think it matters) and got a surprisingly good deal -- 42.5 to 100. Cache has been slightly disappointing, but I am banking on it's long leases and an 8% yield is still good.
UMS Holdings 1 for 4 Bonus shares. To be honest, I didn't even know that there was a bonus issue until I saw the share price fell 15% and it said XB. Free shares, so it's good.
I also decided not to buy more ETFs (via Autowealth) this month as I will be prioritising warchest over investments. As of now, warchest : vested capital ratio is about 40:60. I also channelled cash into CPF retirement accounts (markets were suddenly high so I decided to sit out and transferred $10k to my daughter's MA so that I can have an extended MA if I need it in future) As I have met the FRS for CPF SA, I was also assessing if I should repay the accrued interest that I owe my future self. In the end, I decided that I might be able to get a better return than 2.5% OA, so I will continue to work on my portfolio and build up my warchest. I believe in focus -- do one thing at a time. Multi-tasking doesn't work when it comes to saving money.
The recent run-up in stock prices is not entirely driven by fundamentals hence its making me feel a little uneasy. Steep gradients are a testament of my earlier (good) decisions, but I had also started thinking about my upper end targets for overvaluation. For now, SG stocks prices are still far from being overvalued (especially those whose PER are <=12).
 |
| Portfolio returns (from stocks cafe) |
Saturday, October 21, 2017
AutoWealth and I
I thought I will also share a bit about why I decided to try out Autowealth. There are just 3 companies offering similar robo-advisory services in Singapore. Autowealth is one of them, the other two are Smartly and StashAway. I have nothing against the other two, but I was drawn to AutoWealth and I believe in fate.
Earlier this year, I had a chance to learn more about their business model from the "brain" behind the formula used by AutoWealth -- Tai Zhi. It was at an exhibition booth at Innovest Unbound and their booth was empty so I went over to ask a few questions.
I had my doubts about the company's sustainability
There are many other screens, but I don't use them.
I have no doubt about their passion to bring investment to the masses. I still have my doubts about the company's sustainability, but I am not buying shares in AutoWealth, so it doesn't matter. If AutoWealth shuts down tomorrow, the shares are held with Saxo Capital, Power of Attorny will cease, and I have the Saxo not-so-sexy portal to still see the market prices, but I will probably have to pay much much higher transaction fees. In the meantime, all I can do is to do a little bit of charitable marketing, in hope of increasing their sustainability. I will definitely increase my AUM with them to about 10% of my portfolio when US equity prices moderate a bit. For now... I am happy to see just 1% of my portfolio grow at a crazy 0.5% per week.
List of ETFs invested:
Earlier this year, I had a chance to learn more about their business model from the "brain" behind the formula used by AutoWealth -- Tai Zhi. It was at an exhibition booth at Innovest Unbound and their booth was empty so I went over to ask a few questions.
I had my doubts about the company's sustainability
- The marketing was a little bit "smoky" because anybody who had bought shares post Aug 2015 would have made decent gains, so I wasn't impressed when they marketed the 5-6% returns after a year.
- The "brain" is honest. His IT guy - the guy who coded his brain out and did the portal - is down-to-earth. I had a fleeting thought that these guys might get conned by someone.
- The fees are so low SGD 18 platform fee/year regardless of the number of transactions. Imagine every customer does weekly buys... lol even monthly buys, I don't know how to earn. On top of that, they charge 0.5% of Asset Under Management (AUM), which is really like a charity business.
- Marketing hasn't been agressive, unlike their competitors, but it shows that they are down-to-earth (again) and watch their bottom line.
- Shares are held in a custodian, so they can be easily "knocked out" of business and the customer don't need them anymore.
I went to research a bit more about the ETFs they recommended and I decided to sign up after a few months. The ETFs recommended have really really low expense ratios. I don't really care about the ETF performance because prices fluctuate and there is nothing much to compare between ETFs other than the expense costs.
Here are some screen shots of how it looks like. I don't know if I can share it but it was one of the burning questions I had before signing up. (Seeing how down-to-earth they are, I decided that I will help them with their marketing lol...)
| There is a portofolio summary. |
 |
| There is a composition chart to show you that they really buy according to the ratios they showed you when you signed up. |
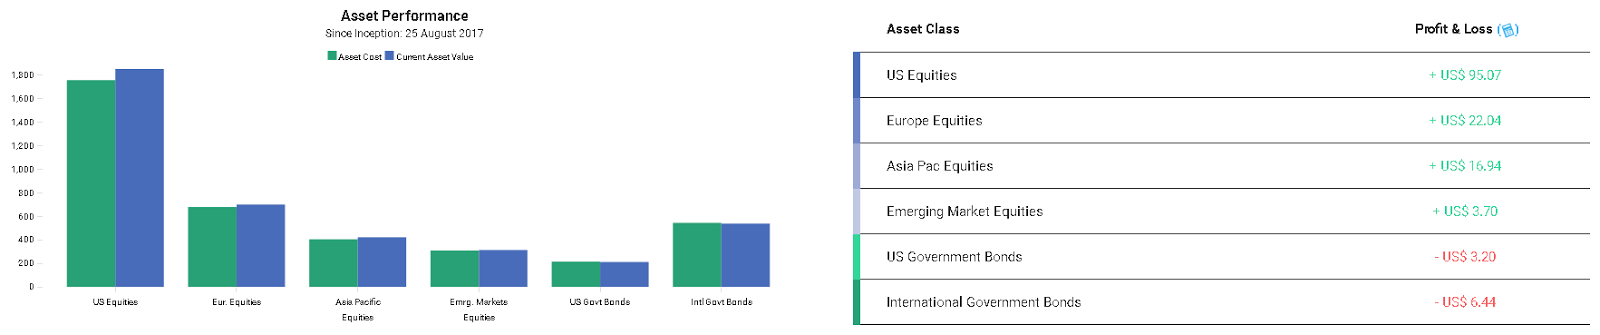 |
| Shows you how each ETF is doing too. |
 |
| Top-up history -- this is important and it's there |
I have no doubt about their passion to bring investment to the masses. I still have my doubts about the company's sustainability, but I am not buying shares in AutoWealth, so it doesn't matter. If AutoWealth shuts down tomorrow, the shares are held with Saxo Capital, Power of Attorny will cease, and I have the Saxo not-so-sexy portal to still see the market prices, but I will probably have to pay much much higher transaction fees. In the meantime, all I can do is to do a little bit of charitable marketing, in hope of increasing their sustainability. I will definitely increase my AUM with them to about 10% of my portfolio when US equity prices moderate a bit. For now... I am happy to see just 1% of my portfolio grow at a crazy 0.5% per week.
List of ETFs invested:
- Vanguard Total Stock Market Index Fund ETF Shares (VTI) expense ratio 0.04%
- Vanguard European Stock Index Fund ETF Shares (VGK) expense ratio 0.10%
- Vanguard Pacific Stock Index Fund ETF Shares (VPL) expense ratio expense ratio 0.10%
- Vanguard Emerging Markets Stock Index Fund ETF Shares (VWO) expense ratio 0.14%
- Blackrock iShares 7-10 Year Treasury Bond ETF (IEF) expense ratio 0.15%
- Blackrock iShares International Treasury Bond ETF (IGOV) expense ratio 0.35%
Thursday, October 5, 2017
What did I buy in Sep 17?
SIA Engineering
Prices continued to fall, especially after the announcement that it will be removed from the ST Index from 1 Oct. On 4 Oct, prices gapped down on news that JP Morgan was selling its 38.8M stake in SIA Engineering. I bought more at $3.30 and $3.20. $3.20 was the previous low in the Aug 2015 "flash crash". Strong balance sheet and monopoly nature of business are the main reasons for me to buy. I will buy more if prices fall below $3.05, another 5% to cover a year of dividends.
SPH
I staked my money at my mouth and bought at $2.76 and $2.62. Prices fell to a low of $2.54 but did not hit my next queue at $2.48. Recently prices have been hovering around $2.70 so I am not taking any further action. I was also comparing SIA Engineering and SPH, and preferred to place more money in SIA Engineering because of its strong balance sheet, doesn't mean that SPH is a better stock because it is still in the ST Index. Did you know that the co-owners of the ST Index are SGX and SPH? Will SPH be removed from the index? I don't know.
Saturday, August 26, 2017
What did I buy in Aug 2017?
The previous posts
- What did I buy in May 2017?
- What did I buy in Jun 2017?
I bought SIA Engineering again in Aug after it fell more than 15% from its 1-yr peak in Jun. I sold SIA Engineering in Jun 2017 after the 25% run-up in price. It's ~$3.50 now and I feel that it is a good price to enter and accumulate more on further price weakness (i.e. $3.40).
I bought Japan Foods in Aug by luck. Someone sold down the share to 40 cents from 43 cents and volume was very low, so I managed to get the share. I had been in the buy queue at 40 cents since May. Basically, I submitted a buy order that had a good-to-date for the whole month so that I don't have to submit orders everyday.
I also bought QAF in Aug after its price fell 25% recently to ~$1.20 after a drop in profits. ($1.585 in Feb 2017) I was attracted to its low Price Earning Ratio (PER) of 7 and stable recurring income from its food manufacturing business.
Stock Review: Singapore Press Holdings (SPH)
SPH closed at $2.76, around its 5-year low. After SPH announced its drop in earnings every quarter, SPH will fall by about 20 cents. The drop became sharper after 31 Jul when it was announced that Ng Yat Chung, ex-NOL CEO, would become the SPH CEO wef 1 Sep 2017. Neptune Orient Lines (NOL) was sold to France CMA CGM and majority shareholders probably lost money.
Many people remember Ng for the wrong reasons, so any price drops beyond fundamentals are good opportunities.
Earnings per Share and Dividends
In Q3 financial report, ended 31 May 2017, YTD Q3 (i.e. Q1+Q2+Q3) Earnings per Share (EPS) is 8 cents, compared with 12 cents in 2016. Earnings for Q4 is expected to be higher due to recognition of 701 Search divestment gains, which will bring the EPS up to (estimated) 16 cents.
Dividends had been steadily falling, from 24 cents in 2012 to 18 cents in 2016. Meanwhile, prices had been mostly kept above $4 earlier, in 2016, SPH spent most of its time around $3.50. (See Annual Report 2016) Dividend payout ratios had been exceeding earnings, which means SPH has been digging into its savings. I disagree with payout ratios above 90%, so my estimated upper cap on the dividend payout based on estimated EPS is 16 x 90% = 14.4 cents (@5% yield = $2.88). If I were a bit more conservative, I will estimate the dividend as 12 x 90% = 10.8 cents (@5% yield = $2.16). 12 cents as EPS is assuming there is no divestment gain.
Many people remember Ng for the wrong reasons, so any price drops beyond fundamentals are good opportunities.
Earnings per Share and Dividends
In Q3 financial report, ended 31 May 2017, YTD Q3 (i.e. Q1+Q2+Q3) Earnings per Share (EPS) is 8 cents, compared with 12 cents in 2016. Earnings for Q4 is expected to be higher due to recognition of 701 Search divestment gains, which will bring the EPS up to (estimated) 16 cents.
 |
| Extracted from SPH Q3 Financial Report page 24 |
 |
| Extracted from SPH Annual Report 2016 |
Income sources
As the media business is transforming, SPH can choose to reinvent media, or choose to close its media units and become a property developer. In any case, we don't have much control over what is considered their core business.
 |
| My re-representation of data from SPH Q3 Financial Report page 5 |
The good thing about SPH is that they hold valuable land assets (S$4B in value).
- SPH REIT
- Paragon
- Clementi Mall
- Seletar Mall
They have 2 condo development projects
- Sky@eleven (2010)
- Mixed commercial and residential project at Bidadari, next to NEL Woodleigh MRT (est. 2021)
Recurring SPH investments that I like
- Orange Valley Healthcare (2017) - nursing home
- Mindchamps (2015) - childcare and enrichment centre
- Buzz - convenience kiosks/stalls
- Sphere exhibits and Sphere conferences - event management
- Focus Publishing - town council and CDC magazines
25 Aug 2017 - SPH will write-down S$31M in it's Mediacorp TV investments, following Mediacorp's decision to cease print edition of newspaper TODAY.
My views on SPH
When almost every analyst report recommends a sell on SPH, I am recommending a buy. I currently hold 200 units which I bought on a wimp at $3.90 in the 2015 market correction because they bought 20% stake of Mindchamps. I had since regretted hence had not added any. I will buy SPH at $2.76 as it's at a 5-year low and has a projected 5% yield based on a reduced annual dividend of 14 cents. The price might go lower, and my entry points will be every 5% to cover the 5% dividend opportunity.
- $2.76 - 2000 units
- $2.62 - 1000 units (-5%)
- $2.48 - 1000 units (-10%)
- $2.34 - 1000 units (-15%)
Thursday, June 22, 2017
What did I buy in Jun 2017?
The previous posts
- What did I buy in Nov 2016?
- What did I buy in May 2017?
I bought Silverlake Axis at $0.53 in late May. The price fell to near its 1 year low ($0.48 was lowest) and the yield looked attractive 5.6% assuming a 3 cent/year dividend. The business model was heavy on IT maintenance projects with banks which was a rather stable economic moat. However, before you plonk it your cash, be wary that they had a scandal in 2015 -- alleged inflated profits. The share price fell to as low as 35.5 cents on 26 Aug 2015.
I sold some of my SIA Engineering shares in Jun. In the past 6 months, its price had risen 25%. If you recall, I bought some SIA Engineering in Nov 2016. The only reason why I sold some shares was to free up cash to invest in other companies.
I bought Design Studio shares in Jun. It has an attractive yield of 11% assuming a 6.5 cent/year dividend. The business model is doing interior design and renovation projects for condos and hotels. This share caught my attention because I regretted not buying when I saw it 6 months ago. It's price jumped from 46 cents to 64 cents recently. In any case, regretting doesn't justify why I bought. Overall, its business looks sustainable as more buildings are doing renovation, especially when occupancy is rising and rental yields are falling, so landlords usually will zhng their rooms to attract tenants. Before you plonk your money into this share, just to let you know, it's just 2% of my portfolio that is taking this risk. I would love to just throw more money at a 11% yield but I am unsure whether its a value trap.
- What did I buy in Nov 2016?
- What did I buy in May 2017?
I bought Silverlake Axis at $0.53 in late May. The price fell to near its 1 year low ($0.48 was lowest) and the yield looked attractive 5.6% assuming a 3 cent/year dividend. The business model was heavy on IT maintenance projects with banks which was a rather stable economic moat. However, before you plonk it your cash, be wary that they had a scandal in 2015 -- alleged inflated profits. The share price fell to as low as 35.5 cents on 26 Aug 2015.
 |
| Silverlake Axis past 3 years. |
I sold some of my SIA Engineering shares in Jun. In the past 6 months, its price had risen 25%. If you recall, I bought some SIA Engineering in Nov 2016. The only reason why I sold some shares was to free up cash to invest in other companies.
I bought Design Studio shares in Jun. It has an attractive yield of 11% assuming a 6.5 cent/year dividend. The business model is doing interior design and renovation projects for condos and hotels. This share caught my attention because I regretted not buying when I saw it 6 months ago. It's price jumped from 46 cents to 64 cents recently. In any case, regretting doesn't justify why I bought. Overall, its business looks sustainable as more buildings are doing renovation, especially when occupancy is rising and rental yields are falling, so landlords usually will zhng their rooms to attract tenants. Before you plonk your money into this share, just to let you know, it's just 2% of my portfolio that is taking this risk. I would love to just throw more money at a 11% yield but I am unsure whether its a value trap.
Saturday, May 20, 2017
What did I buy in May 2017?
The previous post was What did I buy in Nov 2016?
I was queueing for a few stocks (Japan Food, Chuan Hup, Figtree) in Dec-Jan but did not manage to buy any. As the price went up and up, I sat out of the market.
Recently I sold 25% of my DBS shares at $20.80 to return some cash to my warchest. In 1 month, DBS share price rose from $18.60 to $21.00 or 13%. It was also the 5th wave of rises since its lowest point of $15 in Nov 2016. $15 to $21 is a 40% increase. I will never know if the prices will fall back to it's low of $13 or rise further to $26 (100% increase). 5 waves of rises and 40% in 6 months is certainly a little feverish to me. I will just sit tight and see where the waves are heading.
The rest of my portfolio remained the same. I did not buy any stocks.
I also did a stock take on my portfolio distribution as I had not calculated it since a year ago. Effective yield is 4.1% p.a. For all the effort put in, I am just matching the CPF Special Account (SA) yield of 4%. Excluding Keppel Corp, the yield is 5.13%. 20 years from now, I hope (and I know hope cannot be eaten) that I can tell myself that I made a right bet with Keppel Corp.

I was queueing for a few stocks (Japan Food, Chuan Hup, Figtree) in Dec-Jan but did not manage to buy any. As the price went up and up, I sat out of the market.
Recently I sold 25% of my DBS shares at $20.80 to return some cash to my warchest. In 1 month, DBS share price rose from $18.60 to $21.00 or 13%. It was also the 5th wave of rises since its lowest point of $15 in Nov 2016. $15 to $21 is a 40% increase. I will never know if the prices will fall back to it's low of $13 or rise further to $26 (100% increase). 5 waves of rises and 40% in 6 months is certainly a little feverish to me. I will just sit tight and see where the waves are heading.
The rest of my portfolio remained the same. I did not buy any stocks.
 |
| DBS technical chart |
I also did a stock take on my portfolio distribution as I had not calculated it since a year ago. Effective yield is 4.1% p.a. For all the effort put in, I am just matching the CPF Special Account (SA) yield of 4%. Excluding Keppel Corp, the yield is 5.13%. 20 years from now, I hope (and I know hope cannot be eaten) that I can tell myself that I made a right bet with Keppel Corp.

Sunday, April 16, 2017
Book Review: Lee Kuan Yew by Allison and Blackwill
- The Grand Master's Insights on China, the United States, and the World. Interviews and selections by Graham Allison and Robert D.Blackwill with Ali Wyne. Belfer Center Studies in International Security. Published by The MIT Press.
This book focused on international politics and what Lee Kuan Yew's thoughts of the future were. There were a few key ideas which might help the retail investor decide whether to bet for or against the Singapore economy.
Future of welfare states
In general, he believed that welfare states would pass on more and more debt to the next generation just to implement popular policies that win popular votes. For example, the US and most European countries are severely in debt funding welfare. It incentivises the unemployed to remain jobless, and disincentivises the hardworking workers with 40-50% tax on their income. This will only stop when something drastic enough happens, for example, bankruptcy or major government changes.
Future of corrupted states
This is a no-brainer, but these countries will continue to remaining in their third world or developing status until the government puts in proper order and law. He explained it that order had to come before the law is in place to enforce it. India was an example of having the law but no order. Brazil, Russia, China, were other corrupted countries whose growth had been sabotaged by corrupted leaders.
Future of globalisation
He believed that technology and air transport advancements had offered everyone with equal opportunities to sell goods and services. It will continue to change the way businesses operate and how governments manage their countries. Protectionism will be the downfall of a country. Capitalism is necessary to motivate the good to do better and more for the country. Talents will leave their home country if they don't like their government.
China and US
China will have no reason to want to be a superpower. China is just progressing peacefully. China and US relations will had big impact on every economy. The best outcome is to have good trade relations between the two.
Threat of Terrorism
He mentioned that the threat had been seeded since the 1970s and will be difficult to eradicate. The solution he offered was for the Moderate Muslims to counter the extremist Islamist views being taught in schools.
Future of Singapore
Singapore's future depends on its ability to continually retain talent to run the country. The government needs to build an environment where investors and employees want to be in. The innovative spirit needs to be fused into the young, from young, at home and in school. The future workforce is one that continuously learns and adapts.
I am now interested to read the book From Third World to First. This book is not really a propaganda-type of book. It is written objectively, and perfect for anybody interested to learn about international politics. I am still betting my money on Singapore's economy, by buying Singapore stocks, and also choosing companies which have overseas investments. There is definitely a lot of economic potential in China and India after their leaders get their act together.
Thursday, February 23, 2017
Stock Review: Singapore Airlines
Singapore Airlines (SIA) is hallmark of Singapore. The brand name itself probably is royalty worthy. We know their business took a hit when the budget airlines entered the market and their hey days were a thing of the past. At their current price of $9.90, is it a value buy?
Usually, the first metric I look out for in a services company is profit margin because these companies usually rely on staff to earn their income. In a service business, premiums are levied, and customers pay if the customers are willing to. As long as they can find enough customers to happily and repeatedly pay them premiums for their services, it's a good business.
Profit Margin
According to the latest financial report, net profit margin is 5.1% for 9 months (568.3M/11,148.5M), which is lower than the previous year's 5.3%. This means that they spend $95 to bring in $100. One thing I don't really like is that fuel costs forms $26 out of the $95. When fuel cost is something we have no control over, we need a fatter margin to cushion the increase in fuel costs..
Return on Assets (= Net Income/Total Assets)
As SIA buys aircrafts and it forms a large part of their assets, which also depreciates a lot, the next important factor to me is the return on assets, which means how efficient SIA is to generate income from its aircraft assets. ROA is 2.6% (568M/21,660M), which is rather low to me. This basically means that for every $100 of assets on their balance sheet, it is earning $2.60 of income. Fancy it like a CPF account. The number will be higher if we exclude some assets, but it won't tilt the scale much.
Dividend Sustainability
Yes, they have a lot of cash, but they also have a lot of debt. Are they paying their dividends with debt or income? We look for companies that have their Free Cash Flow per share >> Dividend per share. This is like saying you need to earn more than you spend to be debt free. FCF per share is -$0.76 versus a Dividend of $0.44. You don't want your parents to borrow money $76 just to give you $44 right? Anyway, SIA's FCF has been negative from 2012 to 2016. FCF was $0.048 in 2011. They probably emptied their warchest in 2011 with the $1.30 dividend. Will they payout $1 dividend again? Well, I don't know, but if they do, I am quite sure they will need to take on a $1.2B loan.
Overall, SIA isn't attractive at $9.90. If I have to give a rough stab on a price I will consider buying SIA, it's probably $5, based on $0.20 dividend and 4% yield. If you are just riding the waves and following the tide, it doesn't really matter which stock you buy (gamble with).
References:
Monday, January 30, 2017
Book Review: How I Made $2,000,000 in the Stock Market by Nicolas Darvas
This is an e-book freely available on the internet with a simple search of the title. I read it yesterday (yes, can finish in a day, just a 100+ pages) and I would like to write a short review for keepsake.
According to Wikipedia, there was controversy over whether he really made those money because nobody had been able to verify the details of his brokerage accounts. He claimed to have made $2.2M within 18 months, from a capital of $10,000, and he documented all the key transactions in his book.
As he was travelling to different countries to dance, he relied on just a weekly Barron's subscription that details all the stock details he needs, and his daily telegram from his broker. Although he claimed that he doesn't need to analyse the fundamentals of companies, I suspect that he was downplaying the role of fundamentals. He merely stated earnings growth as his main fundamental criteria.
He also learnt from every transaction. He analysed why he made profits and losses. He read up a lot to understand how the stock market works. All these are important traits to learn from. He sums it up by saying that you can only trust yourself. He shuts himself out from all news, rumours, people, and just focuses on analysing the numbers. Something still applicable to this day is never ever be emotional about the price.
His box theory that made him famous believes that following price momentum will insure yourself against not being able to know what insiders are doing. Stock prices fluctuate in boxes and move between boxed. If it moved one box up, he would buy, and he would place a stop loss at a price below the box. The main selection criteria for him to start monitoring boxes was a spike in volume compared with previous days/weeks. This is a logical reasoning because when there is an insider rumour/information, usually the volume will spike first, before the official release of information. The problem with this approach is that you will also be buying blind -- purely based on the stock movement. And when prices increase and you are thinking whether to sell, as long as the momentum is still on an uptrend, there is no reason to sell.
He would also spead his purchases into 4 or 5 parts. A proof of concept to buy 5% of the intended total, then when he sees that the price is following his projected path, he adds another 20% each time, then he will just wait and see. When the volume drops, or when the price starts to fall to the lower box, he will sell.
He also acknowledged that this method will only work when the stock market is active. If there are many people sitting out of the market, there won't be enough stock movement for you to follow. To be understood his context, he came up with his theory in the height of a bull run, and his stop loss orders saved him from the 1957 "market crash" where stocks dropped by 50%. He was also lucky because the market recovered within a few months (which suggests that the crash was just a correction and wasn't caused by fundamental economic slowdown), and he rode the upwave for the next 1 year to reap the $2M profits. He also borrowed agressively -- 70 to 90% margin -- to fund his stock purchases. Margin purchases are risky on all counts.
His method likely only works in this one-off scenario. If somebody had done something similar in 2008-2009, he would also have been able to reap similar profits. I doubled my capital too in those years, and I am a nobody. If I had leveraged 90%, I would have multiplied my capital 10 times and will be a millionaire now. His method will also fail to work in the 1997 crash because recovery was prolonged and price fluctuations were erratic because of low volume.
Overall, it is still a good read to learn about market cycles.
Subscribe to:
Posts (Atom)