Tuesday, January 23, 2018

What did I buy/sell in Jan 18?

Singtel I bought 1 lot at $3.60. Fair price, not dirt cheap. Will accumulate if price dips further.

Keppel Corp I sold 1 lot at $8.16, after it gapped up consecutively and +16% over 5 days. After I sold, it continue to climb, i.e. +24% from the low of $7 after the bribery settlement news. I may cash out 1 more lot if the prices continue to gap up, to lower the concentration of Keppel Corp in my portfolio. It has been lowered from 30% to 25%.

Hyflux 6% CPS On the same day I sold Keppel Corp, I bought Hyflux 6% CPS 100 units at $91.70. I thought it was a no-brainer to buy it because the CPS redemption date is 25 Apr 2018, and the shares are going below $92. There is also a 3% dividend payment on 25 Apr. That's a total of 8% + 3% = 11% in 3 months. If Hyflux doesn't redeem the CPS, the dividend rate will be increased to 8%, which is even better right? If Hyflux doesn't redeem the CPS, they are also not allowed to pay dividends to the shareholders of the Hyflux shares. However, I dared not show-hand on this. Keep wondering if I am missing out on anything...

Stock markets around the world are hitting new highs everyday. It's feels like Apr 2015, which is the typical post financial year end reporting euphoria-effect, just that financial year end reporting has not started. This means that it can only go higher, which is probably fuelling the confidence. You would be sitting on 50% gains if you have bought the STI ETF in Feb 2016 at $2.50. Or better, you will be sitting on 80% gains if you have bought Keppel Corp in Jan 2016 at $4.70. Or even better, you will be sitting on 105% gains if you bought DBS in Feb 2016 at $13.01 (To date, I still remember this day because I was queueing at $13.00 and it didn't hit.)

Ok, enough dreaming and back to reality. It's back to the waiting game again -- waiting for the right price.

Proxy indicator - STI ETF stock code ES3

Keppel Corporation
DBS

Wednesday, December 27, 2017

What did I buy in Dec 17?

Singtel I bought more shares when prices hit $3.60 (4.86% based on 17.5 cents) after it went XD (post dividend). Historically, Singtel share prices cycle up and down within a year so I see this as an opportunity to buy. I would have preferred to have a higher yield though.

Stock shopping is beginning to feel more expensive, which is a sign that the market is picking up. In my view, as long as we avoid the medical and food stocks which tend to be over-priced, it's still possible to find some fair price items. For e.g., Singtel, AIMS AMP, QAF, SIA Engineering, ST Engineering. For those with weak hearts, avoid the bank stocks that have risen by 50% from their troughs in Feb 2016, 22 months ago, because you might be in for another roller coaster ride.

Outlook seems to be more positive, which may not be a good thing. Confidence breeds complacency.

Friday, December 8, 2017

How much have I earned and lost in 2017?

How much have I earned and lost in 2016?

My objective for 2017 was to maintain my existing portfolio and receive $10,000, and achieve a stock to cash (exclude emergency funds) allocation ratio of 50:50. I met my target. It is also a milestone for me to have finally reached $1,000/month of passive income. It has been 14 years since I dreamt of hitting this target. It had been a combination of work hard to increase my earned income, to learn how to pick stocks, and to cultivate patience and will-power.

Income was $11,800 (this is based on received, will be $12,800 if based on ex-date), which was largely due to increase in portfolio and better bank interest rates for interest income from Bank of China 2.5%, UOB One 2.43%, Hong Leong Finance 1.7%, CIMB Fastsaver 1%, Singapore Savings Bonds 1.1%. I picked up $29 worth of coins (about 100 coins, of which 40 coins are 5 cent coins, which is still $2). Every coin adds up.

Average dividend yield is 4.56% (based on ex-date). After some rebalancing this year and using retirement calculators, I decided that my objective for 2018 is to increase my average yield by 0.5%, and then maybe another 0.5%/year for another 2 years, to 6%, but I will reassess this at the end of 2018. This will need to be supported by increasing REITs to 50% of my portfolio. Currently, the ratio is about 23%, I will implement this by rebalancing and capital injection at the right prices over 3 years, from 23% -> 33% -> 43% -> 50%.

I also started investing in Vanguard ETFs through Autowealth, adopting a dollar cost averaging approach, but I select which day of the month to deposit my money to buy, hoping to catch low points in a month. I started with $5,000 in Aug 2017, and contribute $400/month. It is currently returning an insane annualised yield of 15%, which I don't believe is sustainable, hence I am taking it slow and steady.

Unrealised profits which is nice to see but cannot eat:
Autowealth = S$260
Singapore Stocks = $20,000
Although we are not at the end of the year yet, I don't foresee much variation over the next few weeks. I will update again if there is a sudden market crash or something.

Objective for 2018: Increase REITs by 10%, increase portfolio yield by 0.5%, increase income to $14,000.

Chart of humble beginnings
Lifetime accumulated dividends and interest, net of losses = $49,000

Portfolio income "methodology": Assuming that I continuously invest $36,000/year or $3,000/month,
In 3 years, accumulated dividends and interest = $100,000, $1,600/month
In 7 years, accumulated dividends and interest = $200,000, $2,200/month
In 10 years, accumulated dividends and interest = $300,000, $2,700/month

Compounding is awesome. Every coin adds up.

Thursday, December 7, 2017

What did I buy in Nov 17?

QAF I bought more shares when prices hit $1.10. As there was price weakness after the oversupply of pork in Australia, I decided to spread purchases over a few months to get a better spread. If prices were to remain at this level, I may add more.

Other shares that I had been watching are:

  • SIA Engineering
  • Comfort Delgro
  • Singapore Press Holdings
  • ST Engineering

I had no luck at the RE&S IPO.

No bargains in the market, so I will continue to save up and wait.

Wednesday, November 8, 2017

Stock Review: M1

Earlier on when M1's price was hovering around $2, I briefly calculated a price tag of $1.75 before I will do a more detailed review of M1's financial report. I just assumed no dividend at year end, hence whole year dividend of 11 cents, -20% discount to factor in -20% YoY decline, divide by 5% yield and arrived at 11 x 0.8 / 0.05 = $1.76.

On 11 Aug 17, the lowest price was $1.705. Prices have been hovering around $1.78, but I think it's time I write a review. High tide floats all boats and the market is at a high tide now so I am ignoring market prices.

In M1's 3Q2017 report, the concluding sentence was "Based on current outlook and barring unforeseen circumstances, we expect a decline in net profit after tax for the year 2017."

"Net profit after tax declined 4.8% year-on-year for third quarter and 13.9% year-on-year for 9 months ended 30 September, 2017. This is in line with our previous outlook statement." -- From here, I think it's safe to assume that it will decline 20% YoY.

9M2017 EPS  = 10.9 cents. assuming straight line decline, annual EPS should be 14.5 cents.

Assuming a payout ratio of 90%, which is the lower end of M1's historical payout ratio, dividend for 2017 = 13 cents.

Assuming 2 more years of consecutive 20% YoY decline,
2018 EPS 14.5 x 0.8 = 11.6 cents
2019 EPS 11.6 x 0.8 = 9.28 cents

Apply payout ratio of 90%, 9.28 x 0.9 = 8.352 cent

5% yield = 8.352 / 0.05 = $1.67
6% yield = 8.352 / 0.06 = $1.39

This is the extent of the margin of safety you can get at lower prices.

Two things were neatly hidden in plain sight which a casual reader will probably miss out.

1. Debt appeared to be downplayed. "Gearing ratio" is a technical term which casual readers will miss. It is calculated by dividing Total Debt by Total Equity. Total Debt is how much the company has borrowed. Total Equity is how much capital and retained earning over the years. When retained earnings is high, it shows that the company has been successful in accumulating wealth. If the company always pays out 100% of earnings as dividends, then $0 goes into Equity. Imagine you have $10,000 in your savings and I lend you $60,000 as unsecured lending (not backed by anything like your branded handbag or gold ring), your gearing ratio is 6 times, and I run a very high risk of not getting my money back because you only have $10,000. 

Interest coverage ratio shows the ability of the company to pay interest expenses with earnings - the higher the better - they were in a better position in 2016 because earnings were higher. Imagine you have a fixed interest expense, and your salary is decreased 20% YoY, then you will find it harder to repay. Usually you need to pay the interest to keep the loan active so that your bank will not force you to sell your assets to raise money.
9M2017 Page 20 of 22 Gearing and Interest Cover
However, this will probably not concern you if you are a shareholder of Starhub because Starhub's gearing ratio is much higher at 6 times. Just for comparison, I had calculated Singtel's gearing ratio too. Just as an illustration, REITs have a gearing ratio of around 30% to max 45%, so you read it in REITs presentation slides as 0.3x or 0.45x.
Accurate as at date of data extraction on 8/11/17
2. There is also a CAPEX item - spectrum rights - that will likely be recorded in Q4 and beyond. The report did not mention how they will fund the purchase, be it cash or loan. When reconciled with the cash flow statement, nothing has been paid yet. 

9M2017 Page 19 of 22 - CAPEX and Commitments
9M2017 Page 3 of 22 Cash Flow Statement - spectrum rights not paid yet
Taking its debt and committed CAPEX into consideration, I am sitting out and will probably review again when the price hits $1.39.

Monday, October 30, 2017

Am I a High Risk Taker?

Risk assessment questions are often biased. Take the below question from Autowealth as an example. I have nothing against them by the way. I consented to be categorised as a high risk taker.
I understand that markets are at times volatile. If my investment portfolio loses 10% of its value, I would:


If I choose Buy more, my risk appetite is assessed to be higher. In most cases, buying more is always a representation of someone who takes high risks. In order of risk appetite, a low risk taker might sell everything.

However, there are two aspects to this. In reality, do these people really buy more or they just choose buy more as a textbook answer? Do they sell everything or hope for prices to recover? 

The typical question is about a down trend scenario. Let us now think about an up trend scenario with the same scenario options. My portfolio has increased by 10%, if I buy more, am I a high risk taker?

From my observation, when prices drop by 5%, most people will not buy more, neither will they sell parts or everything. When prices drop by 10%, most will not buy more, instead, some might sell parts or everything. When prices drop by 20%, most will do nothing. When prices increase by 5%, most people will do nothing. When prices increase by 10%, most will sell, especially if prices had been depressed for some time. When prices increase by 20%, more will buy and not sell anything.

Many surveys and friends have classified me as a high risk taker. In theory and in practice, that is what I do:
Down trend of a stock - I buy more
Up trend of a stock - I do nothing most of the time. Sometimes I sell 25% of my stock's volume to rebalance if prices have risen to a price that I feel it's too high.

For illustration, between Aug 2015 to Jul 2016, I spent at least 100k buying stocks in a year. I felt poorer and poorer every month because prices continued to fall or remained low. I still remember spending 30k in one particular month. For comparison, I only spent about 20k this year. Everyday I wished that I had more money to buy. I asked my broker to increase my buy quota to 40k because I couldn't submit orders to buy queues. I allocated different budget pots for different price drawdown %, so I was at 70-30 stock to cash allocation when the market was just about -20%. When stock prices started rising, I was relieved because I could finally start saving up again, which shows that I am not that high a risk taker? I see myself taking calculated risks, i.e. I know that I have factored in sufficient margin of safety. I know I had done my best evaluation based on all the known information available when I made the decision. My priority is also income investing because that is a double safety net for me -- a margin from income and a margin from capital gain.

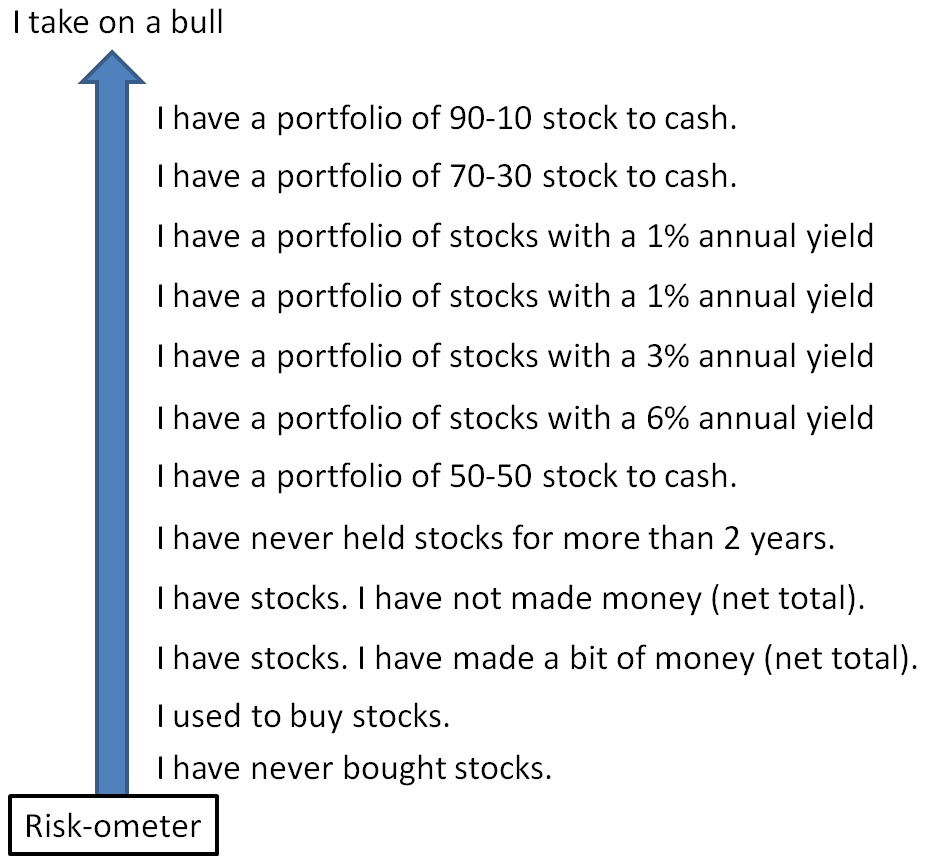
My risk-ometer
I usually hover around 50-50 stock to cash to feel safe. My financial advisor advises 80-20 investment to cash, investment including ETFs, unit trusts and endowment funds. She said I am taking on more risk by keeping 50% cash. Obviously, we don't have the same definition of risk. Similarly, everybody's definition is slightly different. Hence to really assess the person appetite for risk, maybe that one question is probably a good proxy after all, even if it's just a textbook exercise.

Friday, October 27, 2017

What did I buy in Oct 17?

SIA Engineering (covered in previous post) I didn't add further as the price stablised at $3.20.

Cache Logistics 18 for100 Rights Issue. I also applied for excess rights with UOB (don't think it matters) and got a surprisingly good deal -- 42.5 to 100. Cache has been slightly disappointing, but I am banking on it's long leases and an 8% yield is still good.

UMS Holdings 1 for 4 Bonus shares. To be honest, I didn't even know that there was a bonus issue until I saw the share price fell 15% and it said XB. Free shares, so it's good.

I also decided not to buy more ETFs (via Autowealth) this month as I will be prioritising warchest over investments. As of now, warchest : vested capital ratio is about 40:60. I also channelled cash into CPF retirement accounts (markets were suddenly high so I decided to sit out and transferred $10k to my daughter's MA so that I can have an extended MA if I need it in future) As I have met the FRS for CPF SA, I was also assessing if I should repay the accrued interest that I owe my future self. In the end, I decided that I might be able to get a better return than 2.5% OA, so I will continue to work on my portfolio and build up my warchest. I believe in focus -- do one thing at a time. Multi-tasking doesn't work when it comes to saving money.

The recent run-up in stock prices is not entirely driven by fundamentals hence its making me feel a little uneasy. Steep gradients are a testament of my earlier (good) decisions, but I had also started thinking about my upper end targets for overvaluation. For now, SG stocks prices are still far from being overvalued (especially those whose PER are <=12).
Portfolio returns (from stocks cafe)